
Struggling to measure your TikTok ad performance? Without clear TikTok ad benchmarks, it’s hard to know if your CTR, CPC, or ROAS are good or costing you growth. This guide reveals the latest TikTok ad benchmarks, compares performance across industries, and shares proven strategies to boost your results.
Quick summary:
- Define TikTok ad benchmarks (CTR, CPC, CPM, CVR, ROAS, CPA, ER, etc.) and why they matter for goal-setting and diagnosing issues.
- Share 2026 platform averages and context vs. other platforms to gauge “good” performance.
- Provide industry-specific benchmarks (e.g., fashion, finance, travel, F&B, tech) to set realistic targets by vertical.
- Give actionable playbook: authentic UGC-style creatives, daily performance tracking, VBO for ROAS, ongoing testing, and influencer/UGC collaborations.
What are TikTok ad benchmarks?
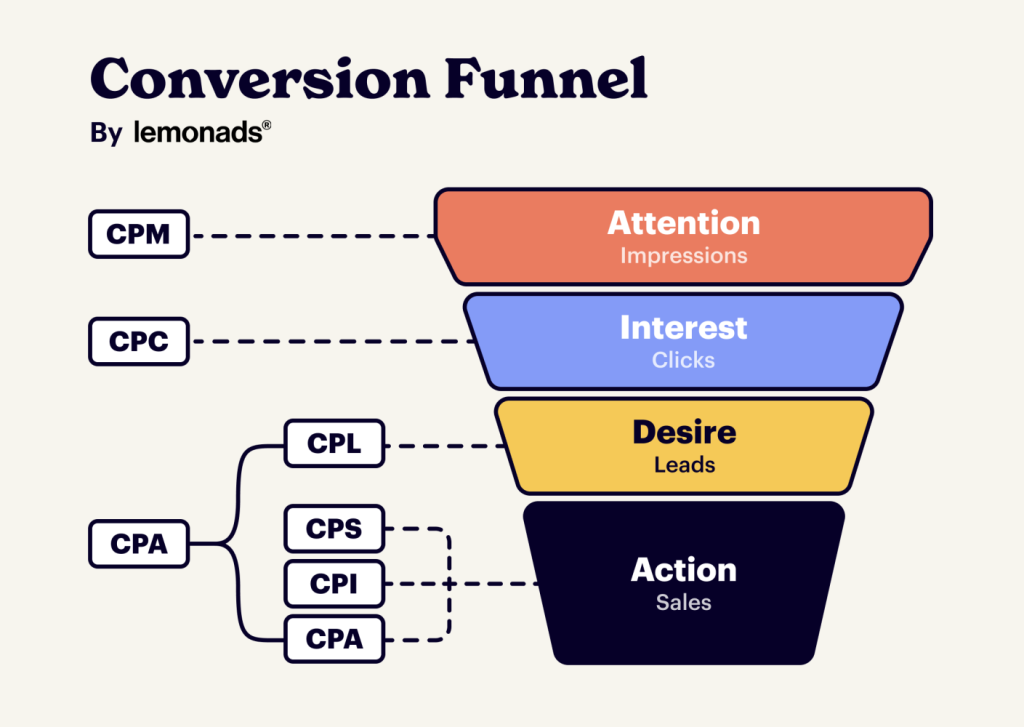
TikTok ad benchmarks are standard measurements advertisers use to evaluate how well their advertising campaigns perform on TikTok. These benchmarks include various TikTok Ads metrics that help assess different aspects of ad performance. Some common benchmarks include:
- Click-Through Rate (CTR)
- Cost Per Click (CPC)
- Cost Per Mille (CPM)
- Conversion Rate (CVR)
- Return on Ad Spend (ROAS)
- Cost Per Action (CPA)
- Engagement Rate (ER)
- Video View Duration
- Impressions
- Conversion Value
Analyzing these benchmarks helps advertisers understand the effectiveness of their TikTok ads, optimize their campaigns, and make informed decisions to achieve better results.
Also, in this article, we’ll offer industry-specific TikTok ad benchmarks, giving businesses and advertisers a comprehensive overview of key indicators within each industry. This valuable information will assist you in optimizing your ad performance based on industry standards and expectations.
Why do you need TikTok ad benchmarks?
TikTok ad benchmarks play a critical role in helping advertisers understand where they stand and what needs to change. Without them, you’re essentially guessing. Is a 0.7% CTR a sign of success or a red flag? Should you be happy with a $1.20 CPC? Benchmarks remove that uncertainty.
They give you context. And context leads to better decisions.
When you know how your campaign compares to platform and industry averages, you’re equipped to set smarter goals, catch underperformance early, and double down on what works.
This is how TikTok ad benchmarks help:
- Set realistic performance goals: Knowing average CTR, CPC, or ROAS helps you establish KPIs that match your budget, industry, and campaign type.
- Identify weak points quickly: Low CTR? It could be your hook or targeting. High CPC? Maybe it’s time to refine your audience segments.
- Benchmark against your industry: By comparing to relevant industry standards, you avoid over- or underestimating your performance.
- Optimize ROI over time: Benchmarks guide your testing and creative iterations, helping you spend more effectively.
For example, say you’re promoting a new skincare product on TikTok. Your CTR is 0.45%, but the industry average is 0.84%—a clear signal your creative isn’t capturing attention. Meanwhile, your CPC is just $0.70, which beats the $1.00 benchmark. That’s good. But your conversion rate is only 0.3%, lagging behind the 0.46% average. That could point to issues with your landing page, offer, or call-to-action.
TikTok Ad Benchmarks by Metric
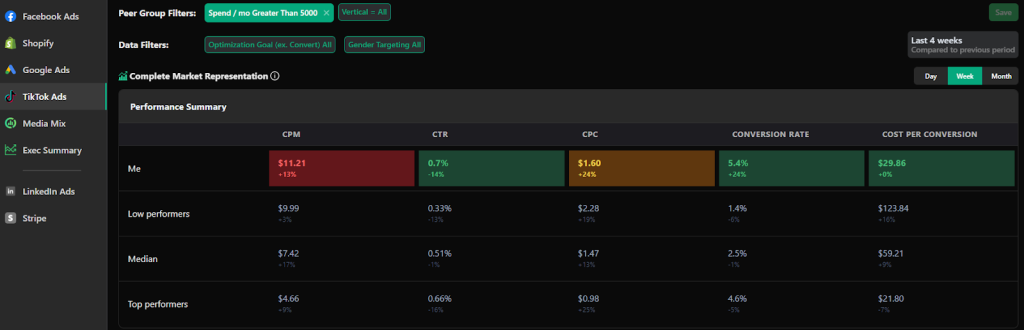
To understand how your TikTok ads are performing, you first need to break down the key metrics that matter. These benchmarks represent the 2026 averages across industries based on recent data from marketing analytics platforms like Lebesgue, and TikAdSuite, helping you compare your results with what’s considered “healthy” on the platform.
These numbers are not just nice to know; they’re the foundation for improving your ad strategy, creative decisions, and media buying efficiency.
| Metric | TikTok Average | Why It Matters |
| Click-Through Rate (CTR) | 0.61% | Measures how compelling your ad is. A higher CTR means your creative and messaging are working. |
| Cost Per Click (CPC) | $0.10 – $1.00 | Indicates how efficient your ad spend is. A lower CPC means you’re paying less for each visitor. |
| Cost Per Mille (CPM) | $4.80 | Tracks the cost of 1,000 impressions. This matters for brand awareness campaigns. |
| Conversion Rate (CVR) | 2.01% | Shows how many people are taking action after clicking. Essential for ROI-driven campaigns. |
| Return on Ad Spend (ROAS) | 2.21 | Measures revenue per dollar spent. A benchmark for profitability. |
| Cost Per Action (CPA) | $32.74 | Indicates the average cost to acquire a customer in e-commerce, directly impacting your bottom line. |
| Engagement Rate (ER) | 5–16% | Tracks how many users interact with your ad. Useful for gauging brand interest and content strength. |
Let’s break a few of these down further.
Click-Through Rate (CTR)
An average CTR ranging from 0.61% suggests your creative needs to hook attention quickly. According to TikAdSuite, Spark Ads often produce a 2.4x higher CTR than standard in-feed ads. If you’re below this, try tightening your hook in the first 2 seconds, using motion or direct address, or switching up your creative angle.
Cost Per Click (CPC)
TikTok’s average CPC sits incredibly low between $0.10 and $1.00 in 2026, making it highly cost-effective compared to platforms like Facebook or Instagram. If your CPC is higher, review your targeting or test simpler creatives that drive curiosity.
Cost Per Mille (CPM)
The platform average for Cost Per Mille (CPM) is currently $4.80. This metric tracks the cost of 1,000 impressions and is a vital indicator for brand awareness campaigns. If your CPM is significantly higher than this benchmark, broadening your audience targeting or refreshing your creative to avoid ad fatigue can help lower costs.
Conversion Rate (CVR)
TikTok delivers a strong average CVR of 2.01%, showing that when the creative aligns well with the offer, users are highly likely to take action after clicking. E-commerce conversion campaigns continue to drive this metric up. Focus on tightening your landing page experience or utilizing TikTok native shopping features if your CVR lags behind this benchmark.
Return on Ad Spend (ROAS)
With an average ROAS of 2.21, TikTok continues to deliver solid bottom-line value for advertisers. Implementing VBO (Value-Based Optimization) and heavily utilizing user-generated content (UGC) can help maximize this return metric, ensuring every dollar spent translates to profitable revenue.
Cost Per Action (CPA)
The average e-commerce CPA on TikTok stands at $32.74. This metric indicates the average cost to acquire a paying customer and directly impacts your overall profitability. To effectively drive down your cost per acquisition, focus on testing different creative hooks, refining your target audiences, and making the checkout process as frictionless as possible.
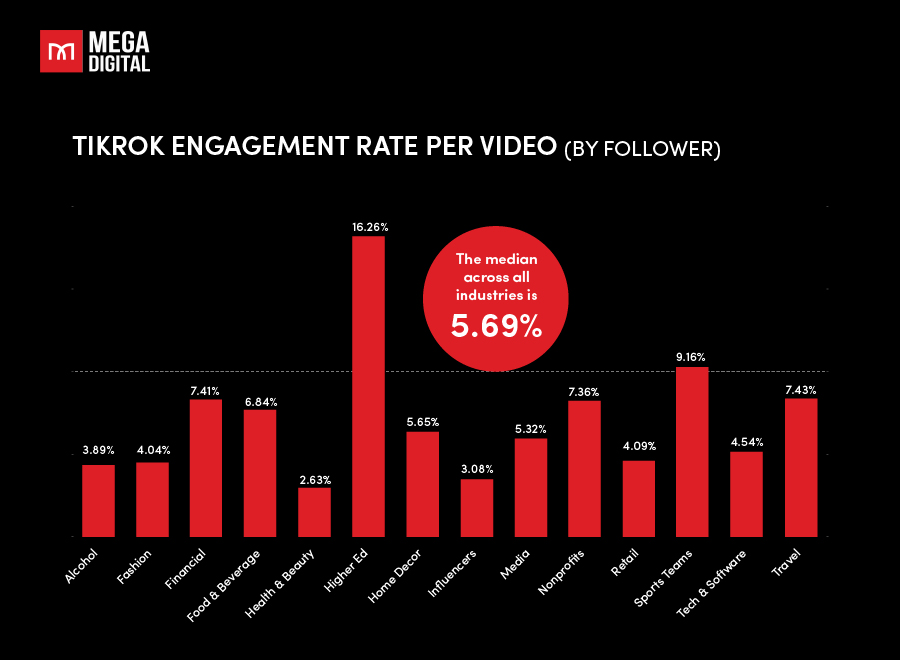
Engagement Rate (ER)
TikTok continues to outperform most platforms when it comes to engagement, with ERs ranging from 5% to 16%. In contrast, Facebook’s ER hovers around 0.09% and Instagram’s around 1.22%. This is why brand storytelling and UGC-style content work exceptionally well on TikTok.
While these benchmarks offer valuable insights, experimentation and adaptation are key. Advertisers should continually test strategies to uncover the perfect formula for success on TikTok.
TikTok Ad Benchmarks by Industry
TikTok ad performance can vary significantly depending on your industry. A 0.3% CTR might be below average in fashion, but considered solid in financial services. That’s why understanding industry-specific benchmarks is essential.
Below is a breakdown of benchmarks across major verticals, including CTR, CPC, CPM, CVR, ROAS, and ER—so you can set realistic expectations and identify where your campaign stands.
Alcohol
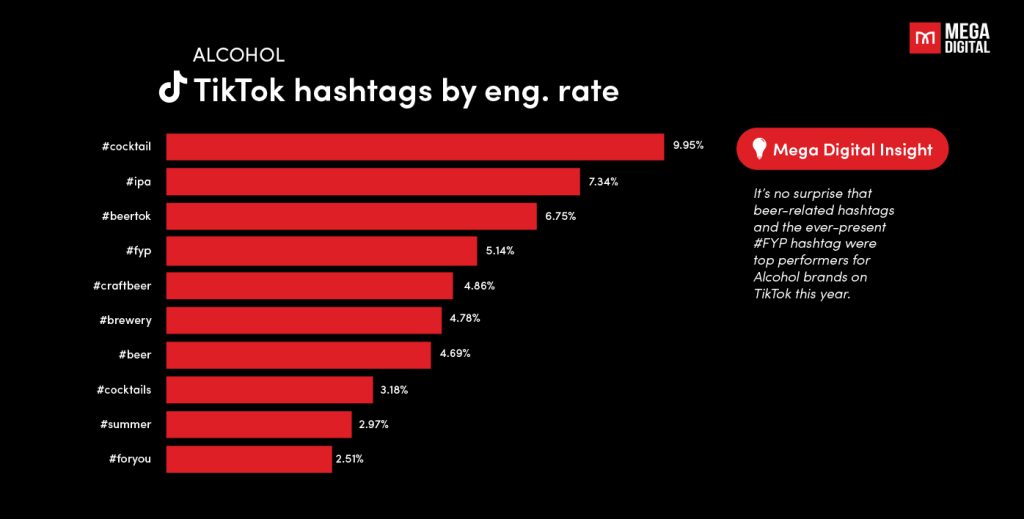
Running alcohol ads on TikTok is both tricky and promising. It requires careful planning and following TikTok’s rules.
TikTok has strict policies, like no alcohol promotion for minors and no encouraging irresponsible drinking. Advertisers must understand TikTok’s ad and content rules and follow local laws before launching campaigns.
That’s why the TikTok ad benchmarks for the alcohol industry are slightly different from the overall averages. Based on the data from Rival IQ4, the alcohol industry has the following benchmarks for TikTok ads:
| Metrics | Alcohol Industry | TikTok Ads Average |
|---|---|---|
| Click-through rate (CTR) | 0.18% | 0.84% |
| Cost per click (CPC) | $0.5 | $1 |
| Cost per mille (CPM) | $8 | $10 |
| Conversion rate (CVR) | 0.8% | 0.46% |
| Return on ad spend (ROAS) | 3.5 | 1.67 |
| Engagement rate (ER) | 18% | 5-16% |
Fashion
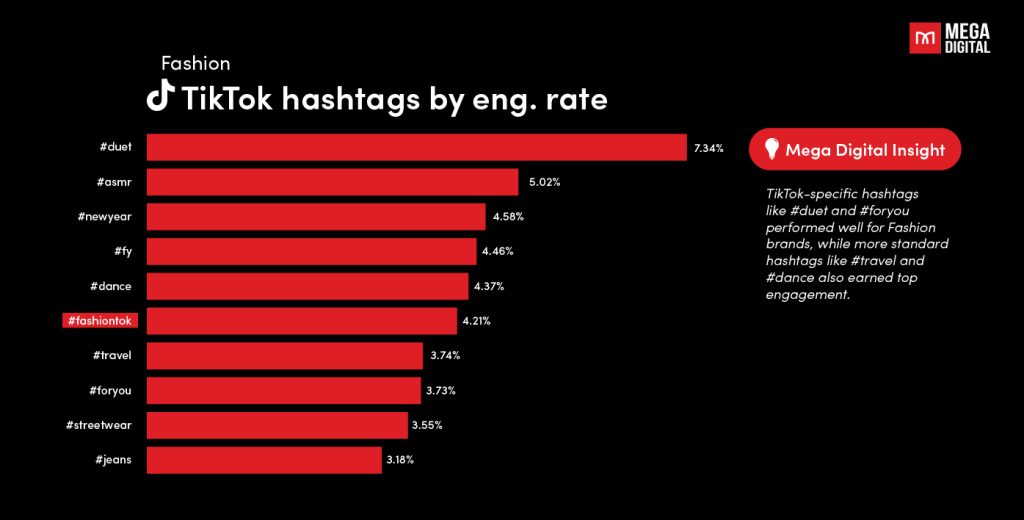
Fashion brands found themselves with lower engagement rates on Facebook, Instagram, and Twitter compared to other industries, but TikTok proved to be a more fruitful platform, with engagement rates hovering around the median.
For fashion brands seeking improved results, it is advisable to allocate more resources to TikTok, given its current higher engagement returns compared to other channels. Additionally, optimizing content quality by reducing post frequency on TikTok could boost overall performance on the platform.
| Metrics | Fashion Industry | TikTok Ads Average |
|---|---|---|
| Click-through rate (CTR) | 0.25% | 0.84% |
| Cost per click (CPC) | $0.8 | $1 |
| Cost per mille (CPM) | $12 | $10 |
| Conversion rate (CVR) | 0.6% | 0.46% |
| Return on ad spend (ROAS) | 2.5 | 1.67 |
| Engagement rate (ER) | 15% | 5-16% |
Financial service
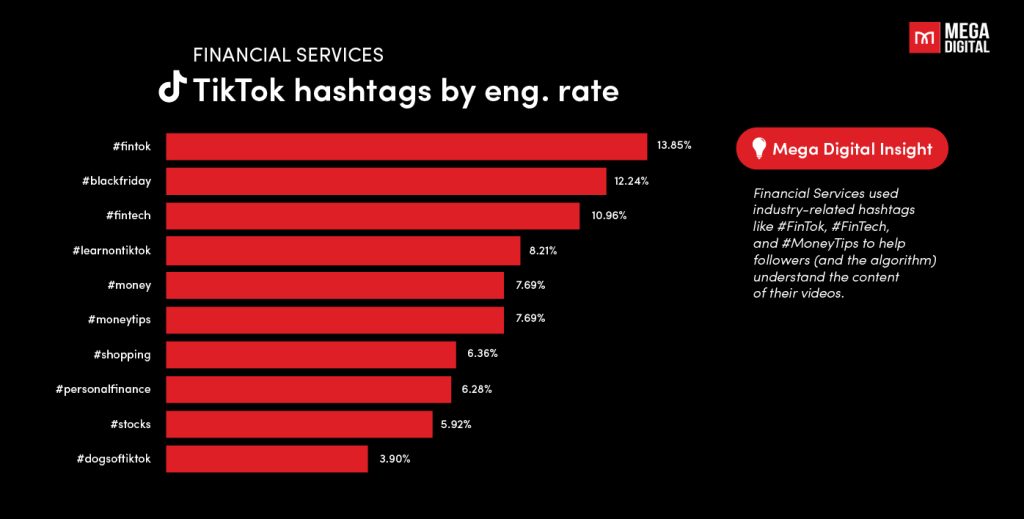
Financial service brands excelled on TikTok, securing a noteworthy fourth place. Despite achieving below-average engagement rates on Facebook and Instagram and posting less frequently on these platforms compared to other industries, they found success on TikTok.
To capitalize on this achievement, Financial service brands can consider repackaging their best-performing video content for use on other channels. Notably, educational hashtags like #FinancialLiteracy and #LearnOnTikTok performed exceptionally well, indicating a strong interest among Financial service followers in educational content.
| Metric | Financial Services Industry | Average TikTok Ads |
|---|---|---|
| Click-through rate (CTR) | 0.1% | 0.84% |
| Cost per click (CPC) | $1.5 | $1 |
| Cost per mille (CPM) | $15 | $10 |
| Conversion rate (CVR) | 0.4% | 0.46% |
| Return on ad spend (ROAS) | 1.2 | 1.67 |
| Engagement rate (ER) | 8% | 5-16% |
Food & Beverage
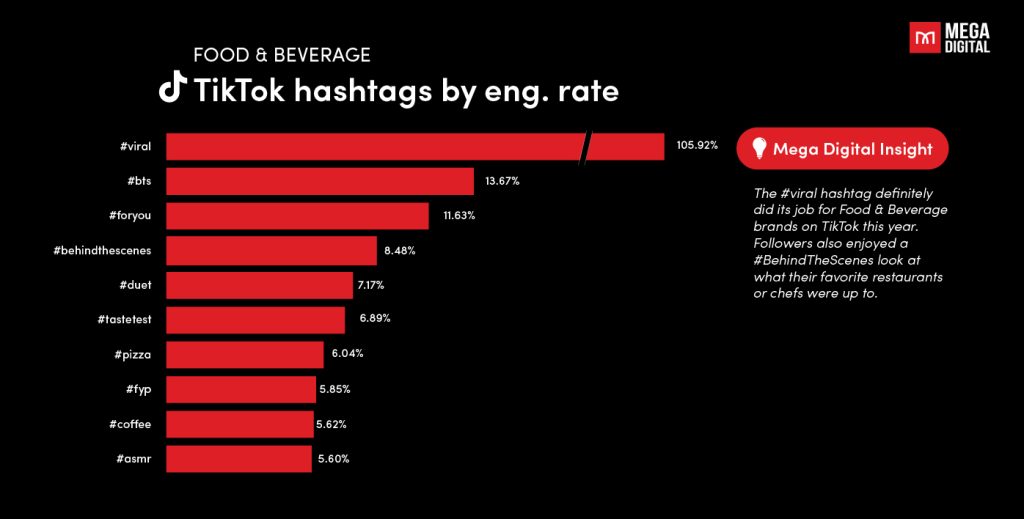
Food and Beverage brands struggled to generate high engagement rates on Facebook and Instagram but was active well on TikTok. This year, the #viral hashtag worked wonders for Food and beverage brands on TikTok. Followers also relished a #BehindTheScenes glimpse into the activities of their beloved restaurants or chefs.
To improve their online presence, these brands should consider experimenting with how often they post to gauge if more frequent posting boosts fan engagement. Additionally, successful strategies involve incorporating popular hashtags, especially those related to holidays, and offering behind-the-scenes content with chefs and food personalities. These approaches have proven effective across different social media channels, providing actionable ideas for improvement.
| Metrics | Food & Beverage Industry | Average TikTok Ads |
|---|---|---|
| Click-through rate (CTR) | 0.32% | 0.84% |
| Cost per click (CPC) | $0.6 | $1 |
| Cost per mille (CPM) | $9 | $10 |
| Conversion rate (CVR) | 0.7% | 0.46% |
| Return on ad spend (ROAS) | 2.8 | 1.67 |
| Engagement rate (ER) | 16% | 5-16% |
Health and Beauty
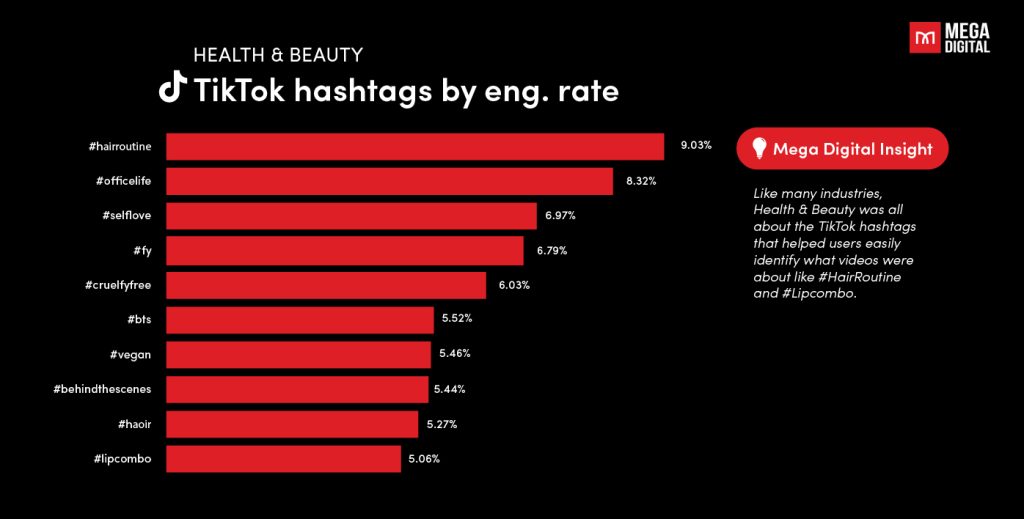
Health and beauty brands faced challenges in captivating their audience, lagging behind other industries with engagement rates approximately half of the median across various channels.
To enhance their online presence, these brands are encouraged to maintain a strong focus on platforms like TikTok and Instagram, especially TikTok, as they have proven more effective for engagement. Additionally, investing in short videos has shown positive outcomes, suggesting a continued emphasis on this content format.
| Metric | Health & Beauty Industry | Average for TikTok Ads |
|---|---|---|
| Click-through rate (CTR) | 0.32% | 0.84% |
| Cost per click (CPC) | $0.7 | $1 |
| Cost per mille (CPM) | $11 | $10 |
| Conversion rate (CVR) | 0.6% | 0.46% |
| Return on ad spend (ROAS) | 2.5 | 1.67 |
| Engagement rate (ER) | 15% | 5-16% |
Higher education
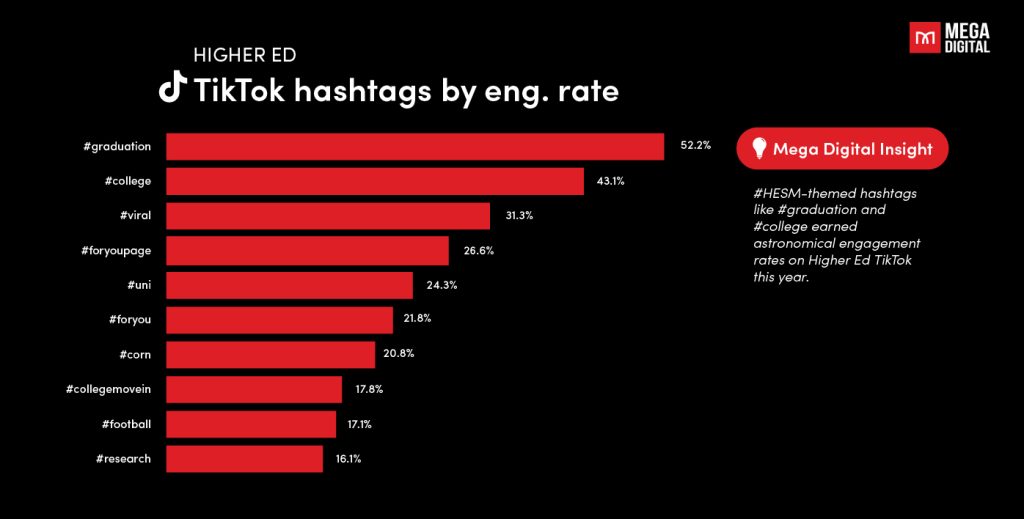
Higher education institutions excelled on TikTok with impressive engagement rates—5 times the median rate on Instagram and 3 times on Twitter. Institutions are advised to diversify post types beyond photos to further enhance engagement. Incorporating popular hashtags related to campus activities, such as #graduation or #CollegeMoveIn, provides followers with a glimpse into college life, contributing to even higher engagement rates.
| Metric | Higher Education Industry | Average TikTok Ads |
|---|---|---|
| Click-through rate (CTR) | 0.32% | 0.84% |
| Cost per click (CPC) | $0.6 | $1 |
| Cost per mille (CPM) | $9 | $10 |
| Conversion rate (CVR) | 0.7% | 0.46% |
| Return on ad spend (ROAS) | 2.8 | 1.67 |
| Engagement rate (ER) | 16% | 5-16% |
Home decoration
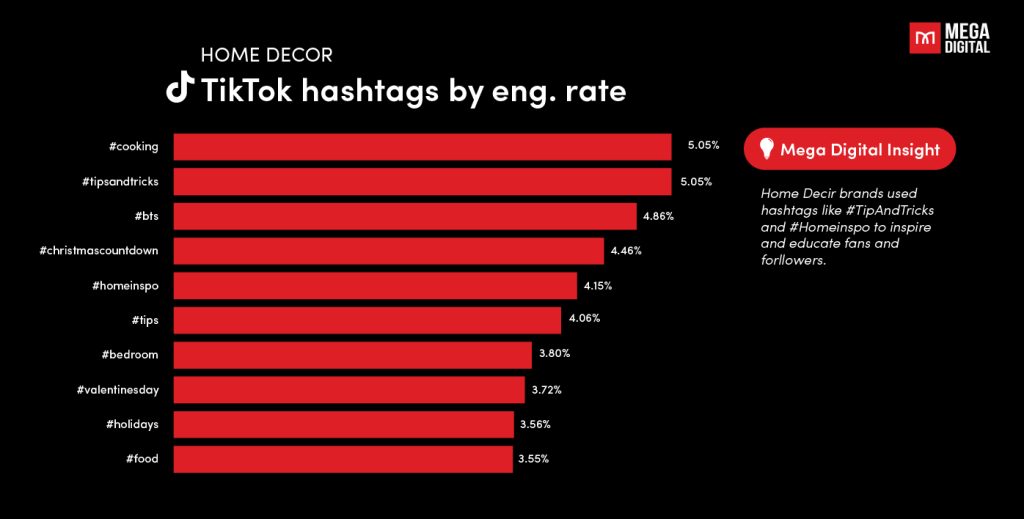
Home decor brands are struggling to connect with audiences on Facebook, Instagram, and Twitter, earning lower engagement rates. However, they perform better on TikTok, with 59,7B views on #TipsAndTricks and 4,8B views on #HomeInspo. The suggestion is to increase posting and engagement on TikTok, capitalizing on its success. Investing in giveaways on Instagram is also recommended for improved engagement on that platform.
| Metric | Home Decor Industry | Average TikTok Ads |
|---|---|---|
| Click-through rate (CTR) | 0.15% | 0.84% |
| Cost per click (CPC) | $0.4 | $1 |
| Cost per mille (CPM) | $6 | $10 |
| Conversion rate (CVR) | 0.5% | 0.46% |
| Return on ad spend (ROAS) | 2.2 | 1.67 |
| Engagement rate (ER) | 12% | 5-16% |
Retail
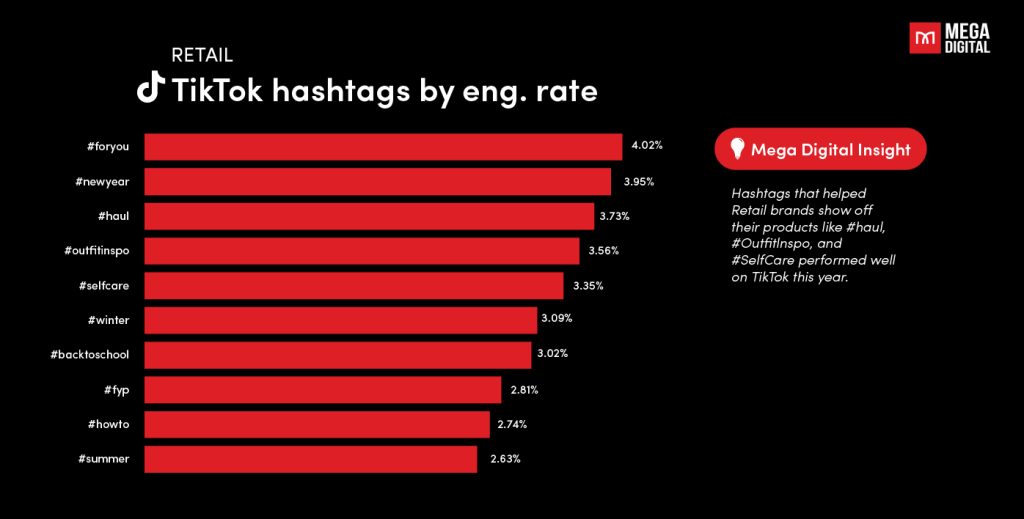
Retail brands faced challenges this year as they faded in engagement rates across all four social media channels – TikTok, Facebook, Instagram, and Twitter. To enhance social performance, the suggestion is to focus on TikTok to extend brand awareness, boost engagement, and experiment with videos, particularly short videos on TikTok. Additionally, holiday- or product-themed hashtags are recommended to help fans and followers visualize retail products in their spaces.
| Metric | Retail Industry Benchmark | TikTok Ads Average |
|---|---|---|
| Click-through rate (CTR) | 0.25% | 0.84% |
| Cost per click (CPC) | $0.8 | $1 |
| Cost per mille (CPM) | $12 | $10 |
| Conversion rate (CVR) | 0.6% | 0.46% |
| Return on ad spend (ROAS) | 2.5 | 1.67 |
| Engagement rate (ER) | 15% | 5-16% |
Sports teams
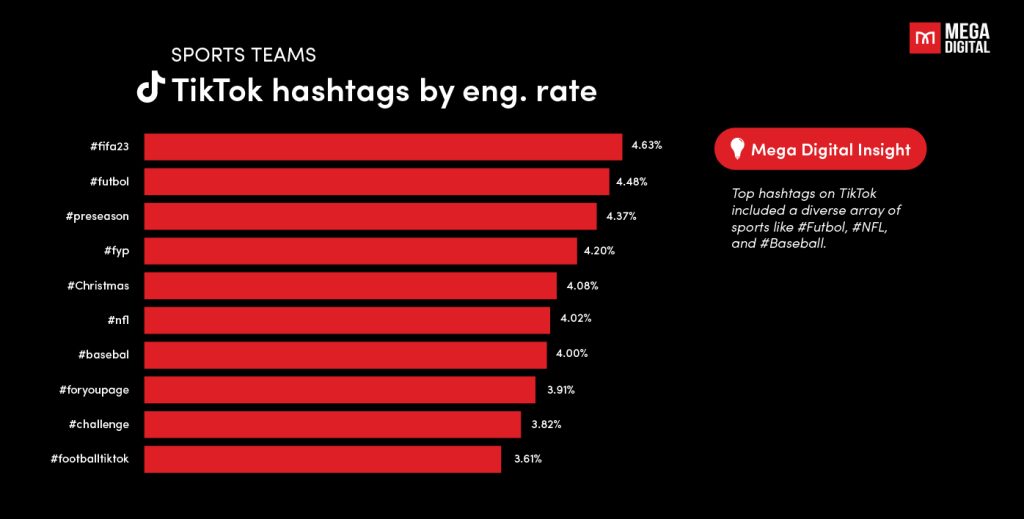
Sports teams have achieved remarkable success in engagement rates across various social media platforms, particularly excelling on Facebook and TikTok. Their consistently high posting frequency provided ample opportunities to engage with followers. Plus, the sports industry is one of the most engaging and creative industries on TikTok, with many sports media, teams, and athletes showcasing their highlights, behind-the-scenes, and challenges on the platform.
To further enhance engagement rates, maintaining the strategy of frequent and early posting is recommended. Additionally, leveraging event-based hashtags, such as #FIFAWorldCup and #SuperBowl, has effectively energized fans and encouraged their active participation during significant sporting events.
| Metric | Sports Industry Benchmarks | TikTok Ads Average |
|---|---|---|
| Click-through rate (CTR) | 0.32% | 0.84% |
| Cost per click (CPC) | $0.6 | $1 |
| Cost per mille (CPM) | $9 | $10 |
| Conversion rate (CVR) | 0.7% | 0.46% |
| Return on ad spend (ROAS) | 2.8 | 1.67 |
| Engagement rate (ER) | 16% | 5-16% |
Tech & Software
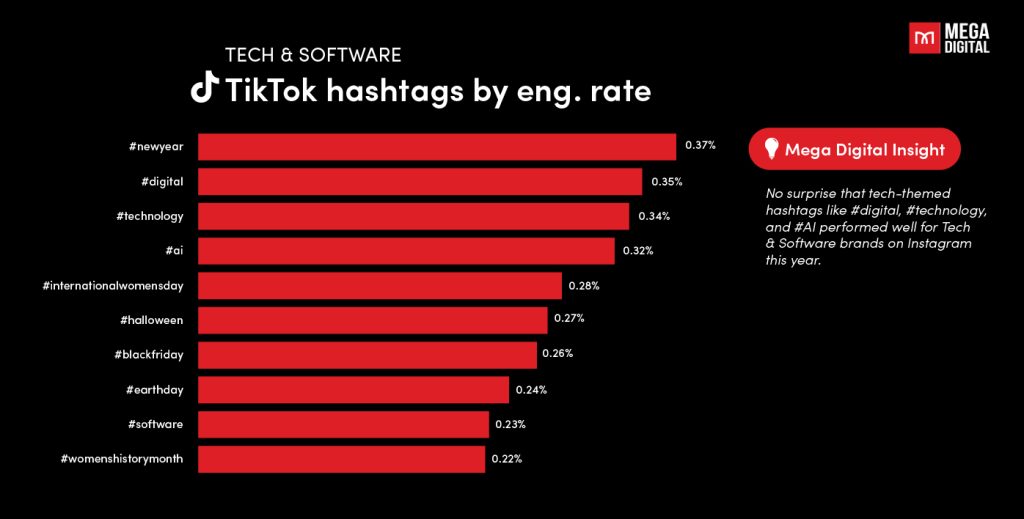
In terms of engagement rates, Tech and software brands find themselves in the middle of the pack, facing challenges on TikTok. The challenge lies in the increased competition and saturation within the tech industry on TikTok. Despite this, there’s a silver lining—once they do capture attention, there’s a good chance that the audience will convert into customers or leads, making their TikTok campaigns effective and profitable. So, while they’re navigating through a competitive landscape, their content is still hitting the mark with the TikTok audience.
To enhance engagement, consider diversifying post types beyond just videos. Embracing hashtags, such as #digital, #technology or #AI, has proven successful, so continuing to incorporate these themes into posts can further boost interaction and connection with the audience.
| Metric | Tech & Software Industry | Average for TikTok Ads |
|---|---|---|
| Click-through rate (CTR) | 0.28% | 0.84% |
| Cost per click (CPC) | $0.9 | $1 |
| Cost per mille (CPM) | $11 | $10 |
| Conversion rate (CVR) | 0.5% | 0.46% |
| Return on ad spend (ROAS) | 2.2 | 1.67 |
| Engagement rate (ER) | 14% | 5-16% |
Travel
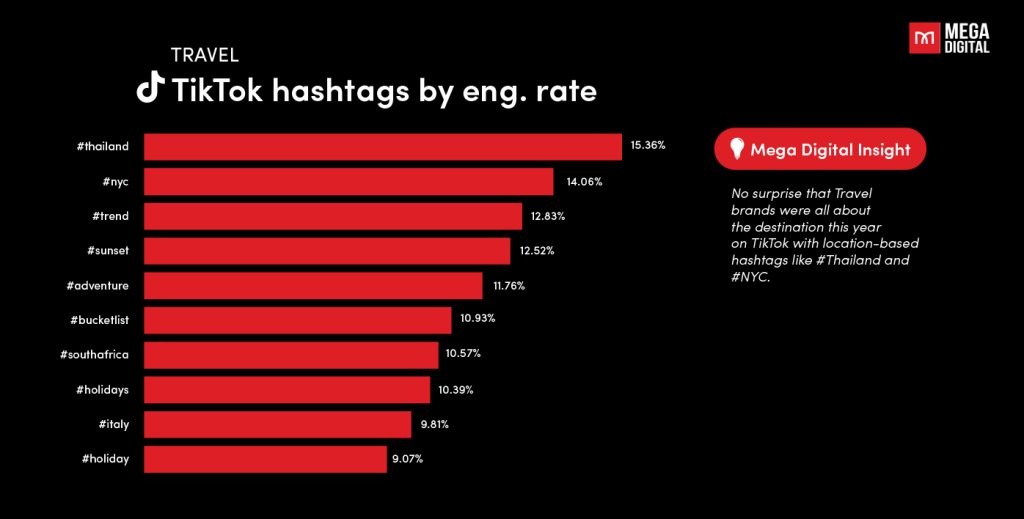
The travel industry is one of TikTok’s most inspiring and creative industries, with many travel agencies, destinations, and influencers showcasing their experiences and tips on the platform. Travel brands secured the third spot on TikTok, standing out with engagement rates approximately 150% higher than the industry median on Facebook.
Consider leveraging seasonal and destination hashtags, as these performed exceptionally well on Instagram and Twitter. Additionally, since posting frequency was below the median across all platforms, experimenting with more frequent posts could potentially lead to increased engagement rates.
| Metric | Travel Industry TikTok Ads | Average for TikTok Ads |
|---|---|---|
| Click-through rate (CTR) | 0.15% | 0.84% |
| Cost per click (CPC) | $0.4 | $1 |
| Cost per mille (CPM) | $6 | $10 |
| Conversion rate (CVR) | 0.5% | 0.46% |
| Return on ad spend (ROAS) | 2.2 | 1.67 |
| Engagement rate (ER) | 12% | 5-16% |
Mega Digital’s tips and strategies to improve ads performance
Just like any other marketing approach, there isn’t a single definitive method for advertising on TikTok. However, there are proven strategies that can significantly boost the effectiveness of your TikTok ad campaigns.
Maintain authenticity in your TikTok ads
TikTok thrives on creativity, so creating dull ads is not an option. Your ads should be engaging and attention-grabbing. The visuals, videos, or copy you incorporate should align with your brand identity and target audience. Speak in the language and voice that resonates with your audience.
Let your ad reflect that identity, whether your brand is cool and trendy or more serious. Even traditionally serious brands, like the Washington Post, effectively infuse humor and playfulness into their TikTok content while staying true to their mission of storytelling and informing.
Track ad performance regularly
On average, TikTok campaigns see a 50% reduction in CPC and a 30% increase in CTR when advertisers actively monitor and optimize their campaigns daily.
Use the TikTok Ad Manager to monitor your ad performance closely. Analyze crucial TikTok metrics like click-through rates, conversion rates, and cost per acquisition. Leverage this data to pinpoint high-performing ad sets and adjust your budget allocation accordingly.
Optimize with VBO (Value-Based Optimization)
Implement Value-Based Optimization (VBO) to tailor your ad delivery to the value it brings to your business. Clearly define key performance indicators (KPIs) aligned with your business objectives and track them to gauge your ads’ effectiveness. Advertisers leveraging VBO on TikTok have achieved a 25% higher ROAS than those without.
Download our free ebook, “Maximizing CRV: Strategies to Optimize Your TikTok Ads”, for five additional ad optimization methods, including ABO, CBO, VBO, AEO, and SPC. Uncover the top 5 strategies from our TikTok agency partner:
- Multi-Objective Campaign Strategy
- Audience-Centric Approach Strategy
- Seasonal Promotions and Sales Strategy
- User Engagement and Retention Strategy
- Brand Awareness and Reach Strategy
Experiment and refine
According to TikTok, advertisers with multiple ad variations witness a 17% increase in CVR compared to a single ad version. Continuously experiment with different ad creatives, target audiences, and optimization approaches to uncover the most effective strategies for your brand. Explore various TikTok ad formats, visuals, and ad copy to identify winning combinations that yield the highest engagement and conversion rates.
Collaborate with influencers/UGC creators
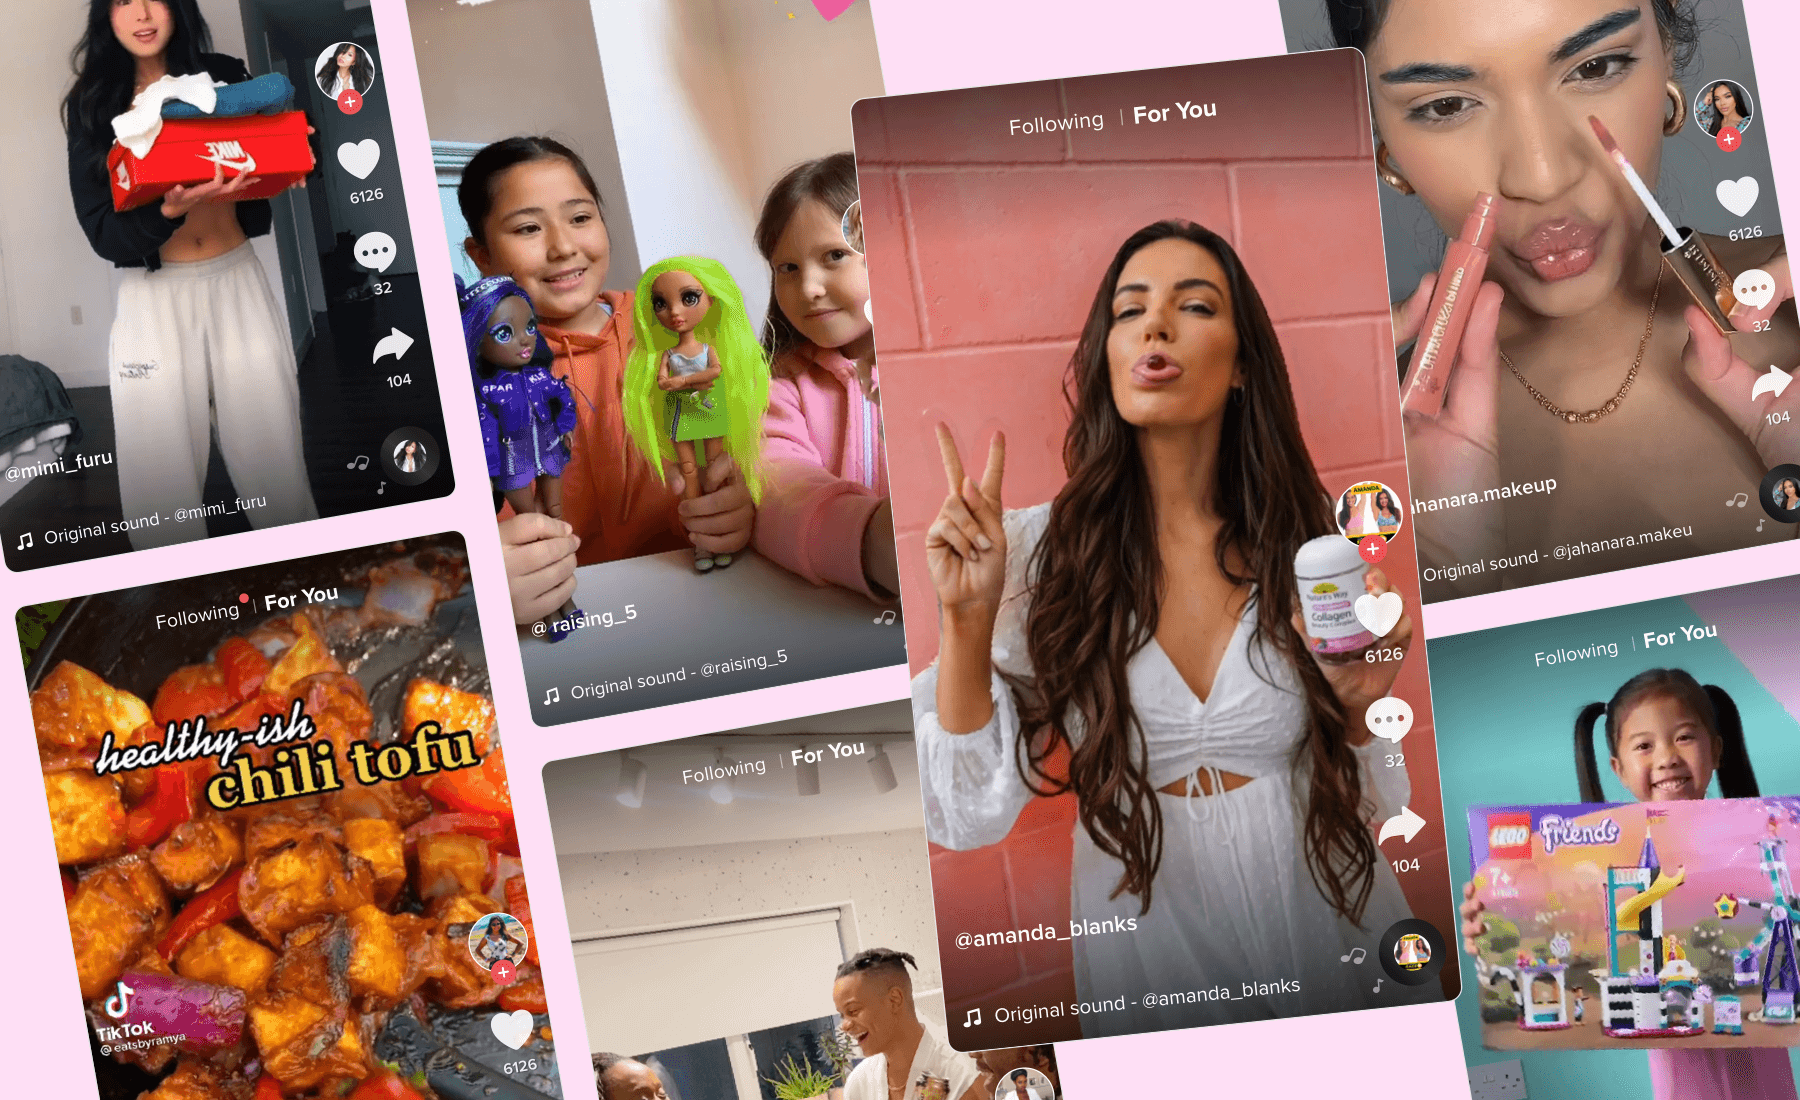
Research indicates that businesses generate an average of $6.50 for $1 spent on influencer marketing, and such collaborations can boost ROI by up to 11%. Partnering with influencers/UGC creators is an efficient way to increase brand awareness and conversions, as influencers/UGC creators often have a dedicated and trusting audience.
You can visit TikTok Creator Marketplace to have more options. When selecting influencers/UGC creators, prioritize those with strong engagement numbers rather than just a high follower count or a verified account.
FAQs about TikTok Ads Benchmarks
A good TikTok ad CTR is around the 0.61% platform average. However, benchmarks vary by industry and format, with B2B and financial services typically averaging 0.10% – 0.28%, while Spark Ads may achieve higher rates.
A high CPM may result from narrow targeting, creative fatigue, or strong competition during peak sales periods. Broaden your audience and refresh your creatives to help reduce costs.
TikTok delivers a competitive average ROAS of 2.21. Spark Ads and Value-Based Optimization can further improve returns, especially for e-commerce brands targeting younger audiences.
Monitor your TikTok ad metrics daily, but avoid major changes during the learning phase, typically seven days or until the campaign reaches 50 conversions.
Final word
As we wrap up our journey through TikTok ad benchmarks, think of this guide as your trusty assistant in the world of marketing. By diving into the nitty-gritty of various industries, we give you insights that directly address your challenges, whether it’s boosting engagement, improving conversion rates, or finding your unique TikTok advertising style.
With these insights and strategies in hand, you’re not just deciphering benchmarks; you’re transforming the way you approach TikTok ads. So, jump in, embrace your creativity, and let your brand sparkle in the vast landscape of TikTok advertising.
Want to let the experts do their job? Then, Mega Digital is here to help! Let’s level up your advertising game!