

While many brands are jumping on TikTok Ads to boost reach and sales, some still struggle to make sense of their campaign metrics. This makes it almost impossible to optimize results. That’s why this blog post will show you the most important TikTok Ads metrics with clear explanations and real benchmarks for smarter optimization!
QUICK SUMMARY
- Define TikTok Ads metrics and why they matter—turn KPIs into insights to improve performance and cut wasted spend.
- Track the 11 must-know metrics (Impressions, Reach, Frequency, Clicks, CTR, CPC, CPM, CPV, CPA, CVR, ROAS) with practical benchmarks for 2026.
- Use the right tools and views: TikTok Ads Manager (custom columns, breakdowns), Pixel, and Events API for accurate conversion/ROAS tracking.
- Fix missing/odd data fast: avoid reach-based rollups, watch overlap by dimensions, include deleted items in filters, and verify pixel/event setup.
What are TikTok Ads Metrics?
TikTok Ads metrics are the performance data points that show how your ad campaigns are doing on TikTok. They include numbers like impressions, reach, CTR (Click-Through Rate), etc.
These metrics help you understand what’s working, what’s not, and where to adjust, whether you’re aiming for awareness, clicks, or conversions. They are all available in TikTok Ads Manager and other tracking tools like TikTok Pixel or Events API.
Why is it essential to measure TikTok Ads Metrics?
Similar to KPI (Key Performance Indicator), TikTok ads metrics let brands and businesses know what is working and what is not in their ad campaigns. Let’s look at why measuring TikTok KPIs is crucial:
1. Improve Ads Performance
Tracking the metrics can help businesses get deeper insights into how well their ad campaigns are performing. If the metric is lower than expected, for instance, brands should be checking on the creative assets to see if it’s targeting a specific audience size. Hence, they can identify the problem more easily and fix the creatives or targeting timely.
>>> Read more: How to Optimize TikTok Ad Performance
2. Cutting down promotional costs
TikTok ads require creators to spend at least $500 for an ad campaign, which is quite expensive if it is not bringing back results. By optimizing TikTok Ads metrics, brands are able to cut down TikTok ads costs and save that money for different types of investment.
11 Most Important TikTok Metrics to Track in 2026
Tracking the right metrics is the only way to truly understand how your TikTok ads are performing. Below are 11 of the most important TikTok metrics to focus on in 2026 and what they actually tell you:
| Metric | What It Shows | Benchmark |
| Impressions | Number of times your ad is shown, including repeat views | No fixed benchmark; monitor alongside frequency |
| Reach | Number of unique users who saw your ad | 10,000-50,000 (test); 100,000+ (awareness) |
| Frequency | How often the average user saw your ad | 3-7 is common range across campaign types |
| Clicks (Destination) | Users who clicked through to your site, app, or product page | No fixed number; CTR used as better reference |
| CTR | Percentage of users who clicked after seeing the ad | ~0.84% average; 1.5–3% for In‑Feed Ads |
| CPC | Average cost per click on your ad | $0.20-$0.99 depending on source and format |
| CPM | Cost per 1,000 impressions | $3.21 average; up to $10+ during holidays |
| CPV | Cost per video view (typically 6+ seconds watched) | $0.10-$0.30 typical |
| CPA | Average cost per conversion (purchase, signup, etc.) | $10-$30 (ecommerce); $20-$50 (lead gen) |
| CVR | Percentage of users who converted after clicking | 2.5% average; can reach 5-10% |
| ROAS | Revenue earned per dollar spent on ads | 2.0+ break-even; 3-4 good; 5+ during strong promotions |
1. Impressions
Impressions tell you how many times your ad is shown on TikTok. Every time your ad appears on someone’s screen, even if they don’t interact with it, it counts as one impression. If the same person sees your ad more than once, each view still adds to the total. This number helps you understand how often your ad is being delivered to users.
How to calculate:
Impressions = Reach × Frequency
However, TikTok tracks this automatically in Ads Manager, so you don’t need to calculate it manually.
Benchmark:
There is no universal “good” number because it depends on your campaign budget and audience size. But we can use frequency as a proxy for whether impressions are reasonable:
- A frequency of 5 to 7 is often considered optimal. It means users saw your ad enough times to remember it, but not so much that they got annoyed.
- If your frequency is below 5, your audience might be too broad or your budget too small.
- If frequency is above 7, users may see the ad too often, which can cause fatigue and dropoff.
So instead of labeling impressions as “low” or “high,” focus on balancing reach and frequency. If impressions seem low, see if your reach and frequency align with your goals. And if frequency is too high, consider expanding your audience or adjusting your bid.
2. Reach
Reach tells you how many different people saw it. It doesn’t matter if one person sees the ad 3 or 10 times. They still count as one in Reach. That’s why Reach is useful when you want to know how wide your ad actually spreads.
For example, if your campaign shows 30,000 impressions but your reach is only 5,000, it means the same users are seeing your ad multiple times. That might be fine for conversion campaigns, but for brand awareness, you’d want to reach more new people.
How to calculate:
TikTok calculates this for you automatically. But you can think of it like this:
Reach = Impressions / Frequency
Benchmark:
While TikTok does not provide specific public guidelines for Reach thresholds, external marketing studies suggest the following general ranges for evaluating campaign scale:
- For smaller test campaigns, 10,000 to 50,000 users reached is solid.
- For broader brand awareness efforts, aim for 100,000 or more users reached.
- If your Reach is under 5,000 after a few days, your campaign might be too narrowly targeted or underfunded.
Remember, more reach doesn’t always mean better results; what matters is reaching the right people with the right message.
3. Frequency
Imagine your ad was shown 50,000 times to 10,000 people. On average, each person saw it 5 times. That average is what Frequency tells you: how often the average user saw your ad during the campaign.
This helps you spot two things:
- Too little exposure: People may not remember your ad.
- Overexposure: They might scroll right past it because it feels repetitive.
How to calculate:
TikTok tracks it for you. In Ads Manager, you’ll see it automatically under campaign reports.
Frequency = Impressions / Reach
Benchmark:
TikTok’s Reach & Frequency tool even lets you set limits so users don’t see your ad too often. In auctions, aim for:
- Frequency 3 to 5 for awareness campaigns.
- Frequency 5 to 7 for conversion-focused campaigns looking to drive action.
- If frequency stays above 8, consider fresh creatives or expand your audience.
4. Clicks (Destination)
This metric counts how many people clicked on your ad and were taken to your website, app, or product page. It does not include likes, shares, or other interactions — just the actual clicks that move users to where you want them to go.
How to calculate:
TikTok shows this automatically in Ads Manager. Just remember:
Clicks (Destination) = Number of users who clicked the main call to action on your ad
Benchmark:
There is no fixed benchmark for raw click numbers, since it depends on your budget and reach. However, a related metric, CTR (click-through rate), is commonly used to evaluate click performance. According to Lebesgue, the average CTR for TikTok Ads is around 0.84 percent across industries.
5. CTR (Click Through Rate)
TikTok CTR shows how many people clicked your ad after seeing it. On TikTok, this is based only on meaningful clicks, like a tap on your call to action, not likes or comments.
This is slightly different from Meta, where CTR is often broken into types like all clicks, link clicks, or outbound clicks. TikTok keeps it simpler, focusing only on clicks that drive traffic to your destination.
Let’s say your ad was shown 10,000 times and got 150 clicks. That’s a CTR of 1.5 percent. If this number is high, your creative is doing its job. If it’s low, people may not find your ad clear, relevant, or interesting.
How to calculate:
CTR = (Clicks ÷ Impressions) × 100
Benchmark:
- Across industries, the average CTR for TikTok ads is around 0.84 percent, according to Lebesgue.
- For In‑Feed ads specifically, a range of 1.5 to 3 percent is considered good.
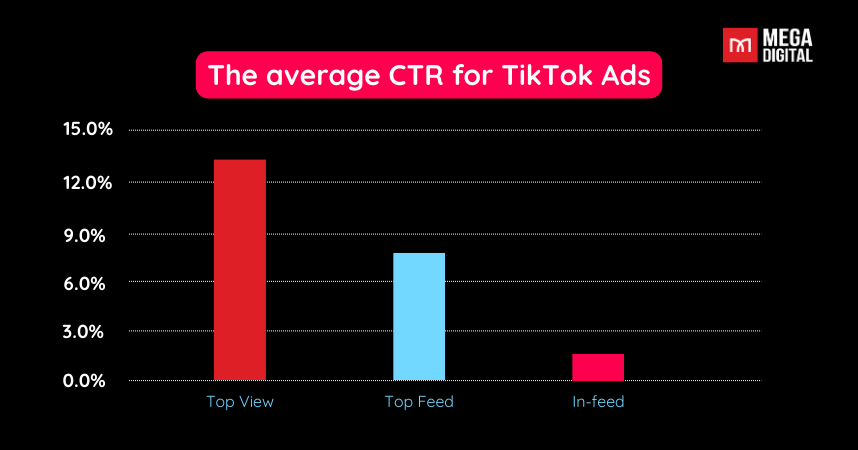
- Premium formats like TopView and Brand Takeover can see much higher CTRs. TopView ranges 12 to 16 percent, and Brand Takeover 7 to 10 percent.
6. CPC (Cost per Click)
CPC tells you how much money you are spending for each click on your ad. It is one of the best ways to measure how efficiently your budget turns into real actions. When your CPC is low, it means you are getting more people to interact with your ad without spending too much.
CPC is especially helpful when comparing different creatives or ad sets. It helps you spot which one brings in the most clicks at the lowest cost, so you can scale the winners and cut the rest.
How to calculate:
CPC = Total Ad Spend ÷ Number of Clicks
You can find this automatically in TikTok Ads Manager.
Benchmark:
- According to Varos (April 2026), TikTok’s median CPC is around $0.99.
- Other studies suggest a healthy range is $0.20 to $0.50, though this varies by industry, objective, and ad format.
7. CPM (Cost per Thousand Impressions)
CPM tells you how much you pay for every 1,000 views of your ad. It is a simple way to measure how efficiently you’re buying visibility. A lower CPM means you’re getting more views for every dollar spent.
For example, if you spend $50 and get 10,000 impressions, your CPM is $5. That means every 1,000 views cost you five dollars. If another ad gets the same 10,000 impressions but costs $80, the CPM jumps to $8, which is less efficient. This can happen if your targeting is too narrow, your bids are high, or your creative isn’t performing well.
How to calculate:
CPM = (Total Ad Spend ÷ Impressions) × 1,000
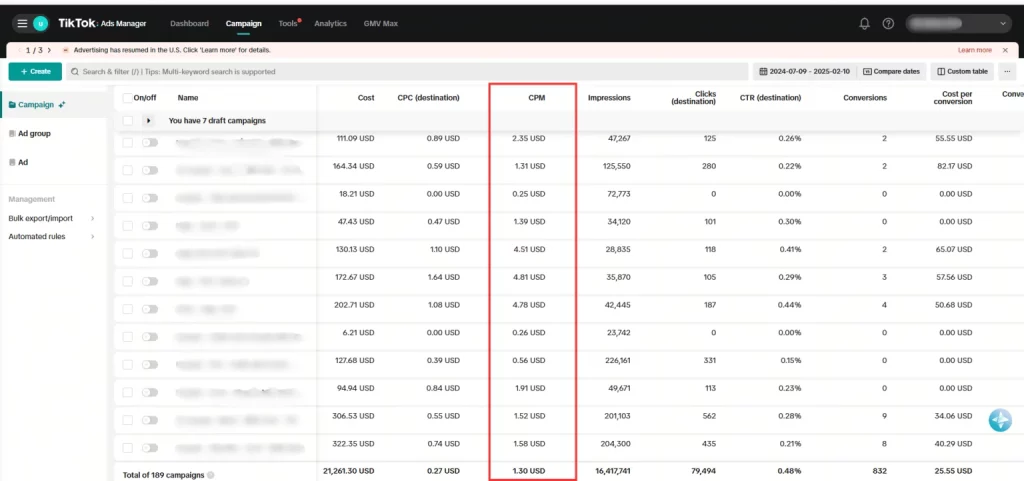
You can find this automatically in TikTok Ads Manager.
Benchmark:
- TikTok’s average CPM is around $3.21, according to Lebesgue.
- Monthly data from Gupta Media shows CPM can range from $2.87 to $6.21, depending on timing and competition.
- During big events or holidays, CPM can go up to $10 or more.
>>> Read more: TikTok CPM: What It Is & Ways to Lower Your Ad Costs in 2026
8. CPV (Cost per View)
Cost per View tells you how much each video view costs. On TikTok, a “view” typically means someone watches at least 6 seconds of your video, or interacts with it during that time.
For instance, if you spend $200 and your ad gets 2,000 views, your CPV is $0.10 per view. If another campaign spends the same but only gets 1,000 views, the CPV doubles to $0.20, which shows your video isn’t holding attention as well.
How to calculate:
CPV = Total Ad Spend ÷ Number of Views
You’ll find this in TikTok Ads Manager.
Benchmark:
- TikTok benchmarks suggest $0.10 to $0.30 is a solid CPV range for most ads.
- In some regions or for highly optimized content, CPV can be as low as $0.01, but that typically requires strong bidding and engaging creative.
9. CPA (Cost per Action or Conversion)
CPA tells you how much, on average, each conversion costs, like a purchase, signup, download, or any goal you set. It shows how efficiently your ad turns clicks or views into real results.
TikTok often uses a 7-day click and 1-day view window, which may give different CPA values than platforms using longer attribution windows.
How to calculate:
CPA = Total Ad Spend ÷ Number of Conversions
TikTok tracks conversions automatically if you set up your pixel or app event.
Benchmark:
- Reports show a typical TikTok CPA ranges from $10 to $30 for ecommerce campaigns, depending on product and industry.
- For lead-generation campaigns in sectors like education or finance, CPAs can range between $20 and $50, due to higher customer value.
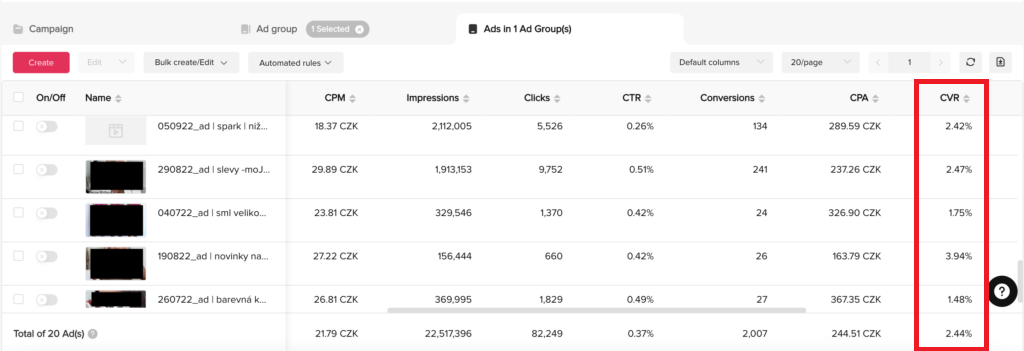
10. CVR (Conversion Rate)
CVR shows the percentage of people who converted after clicking your ad. A “conversion” depends on your goal. It could be a purchase, app install, form submission, or other action. CVR helps you understand how effective your ad is at turning interest into results.
Let’s say 1,000 people clicked your ad, and 80 made a purchase. That gives you a CVR of 8 percent.
How to calculate:
CVR = (Conversions ÷ Clicks) × 100
TikTok Ads Manager shows this automatically if your pixel or event tracking is set up.
Benchmark:
According to Lebesgue, the average CVR for TikTok Ads is 2.5 percent, but high-performing campaigns can reach 5 to 10 percent, especially in ecommerce. For app installs, CVRs may be higher depending on offer and targeting.
11. ROAS (Return on Ad Spend)
ROAS tells you how much revenue you earn for every dollar you spend on ads. It is one of the most important metrics for measuring whether your ad campaign is truly profitable.
For example, if you spend $100 on ads and make $400 in sales, your ROAS is 4.0. That means you earned four dollars for every dollar you spent.
How to calculate:
ROAS = Revenue from Ads ÷ Total Ad Spend
TikTok Ads Manager will show this value if your pixel or conversion API is set up correctly and you pass revenue data.
Benchmark:
- A ROAS of 2.0 or higher is often seen as the break-even point for e-commerce, depending on product margins.
- Strong campaigns can hit ROAS of 3 to 4, and some high-performing brands report 5+ during sales or seasonal campaigns.
- According to data from Varos and Lebesgue, average ROAS on TikTok sits between 1.5 and 3.5, depending on the niche.
>>> Read more: Improve Ad Performance with TikTok Ad Benchmarks 2026
Analytics Tools to Track TikTok Ads Metrics
To measure your TikTok ads performance accurately, you need the right tracking tools, not just the metrics themselves. Below is a breakdown of the main tools you can use to collect, view, and analyze those metrics effectively.
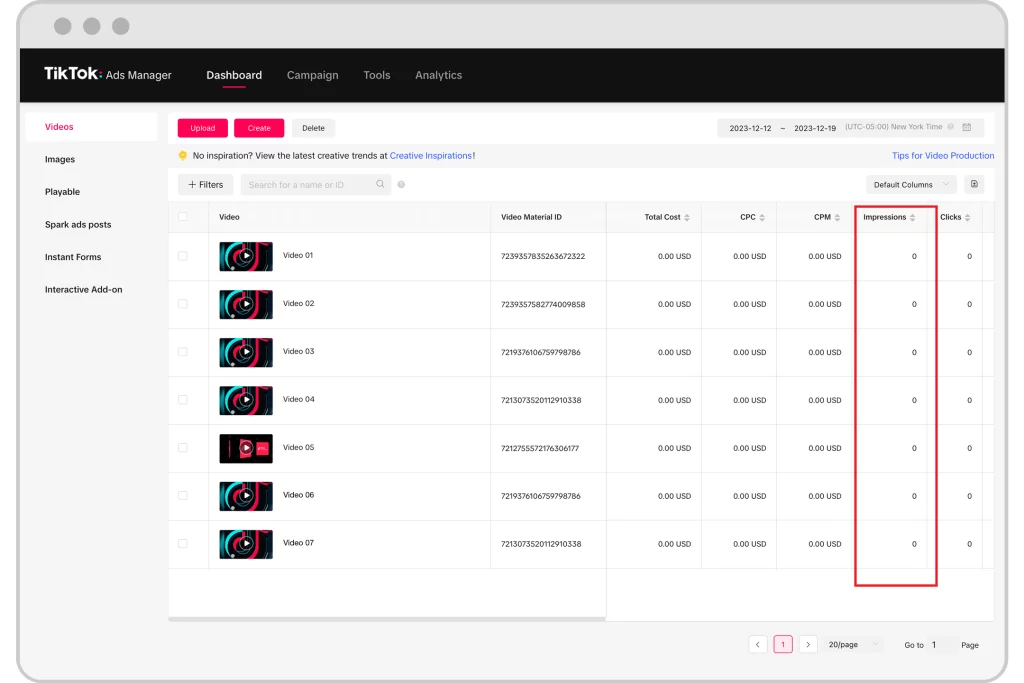
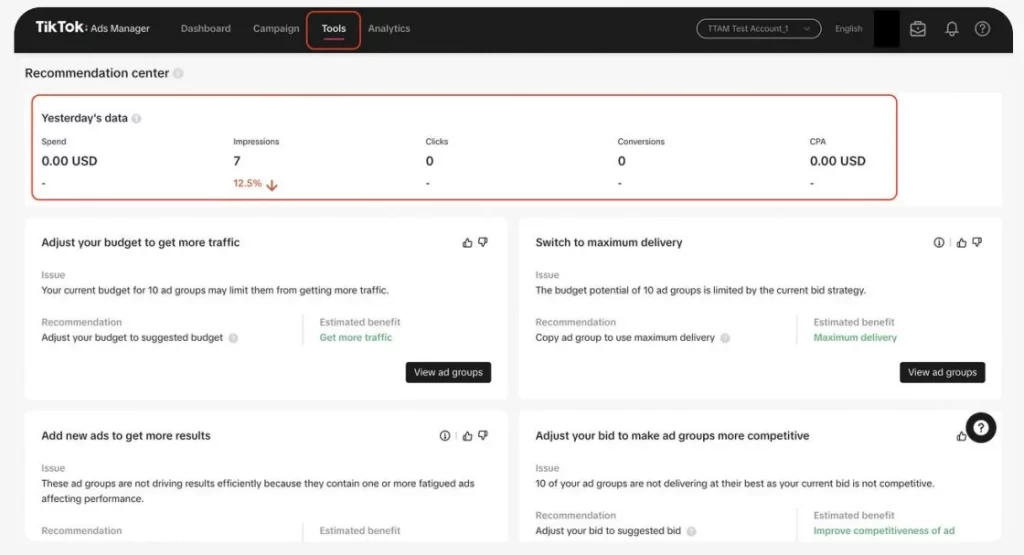
1. TikTok Ads Manager
TikTok Ads Manager is the main tool for tracking the performance of your paid campaigns. It gives you access to all key ad metrics like impressions, clicks, CTR, CPM, CPC, CVR, ROAS, and more.
You can view performance at different levels: campaign, ad group, or ad. The dashboard is fully customizable, so you can focus only on the metrics that matter most to your goals.
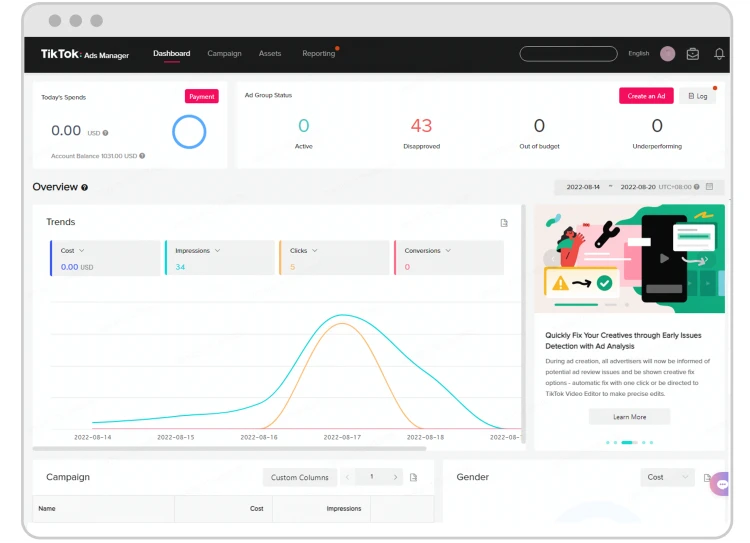
How to view TikTok ads metrics:
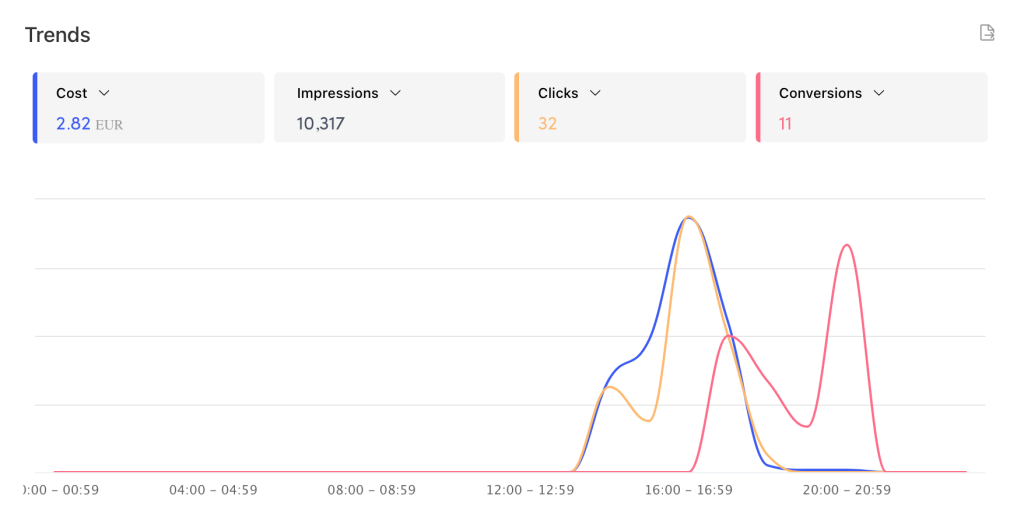
- Open the Dashboard: Go to the Dashboard tab in TikTok Ads Manager. Here, you can view performance graphs for Cost, Impressions, Clicks (destination), and Conversions. Then, click Data under the graph to see a table format. You’ll also find the calendar icon there to adjust your date range.
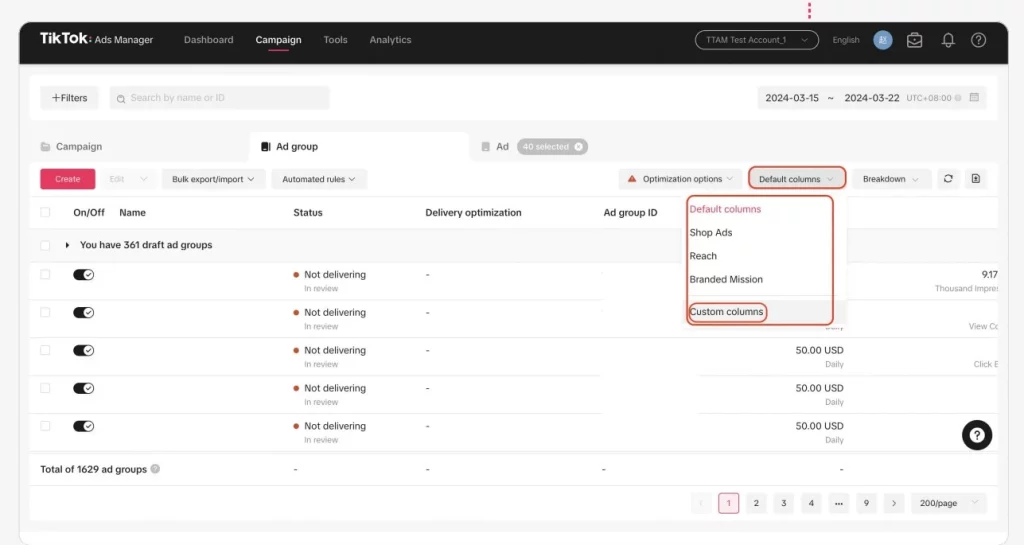
- Go to Campaign View: You can click on the Campaign tab (then Ad Group or Ad) to see a full table of metrics. The default columns include: Status, Budget, CPC, CPM, Impressions, Clicks, CTR, Conversions, CVR, etc.
- Customize Your Columns: Use the Custom Columns dropdown to add or remove metrics. If you want to focus on shop or video metrics more, they’re grouped under Performance or Settings menus
- Breakdown Data for Deeper Insights: Next to Custom Columns is Breakdown. You should use it to segment by Day, Week, Month, or dimensions like country or device
2. TikTok Pixel
If your campaign is focused on sales, leads, or other actions beyond just clicks, the Pixel is a must-have for accurate tracking.
TikTok Pixel is a tool that lets you measure what users do after they click on your ads, like viewing a product, adding to cart, or making a purchase. These actions are called conversion events, and they show up in TikTok Ads Manager as part of your campaign performance metrics.
Pixel data is especially important for metrics such as:
- Conversion rate (CVR)
- Cost per result (e.g., cost per purchase or sign-up)
- Return on ad spend (ROAS)
The Pixel helps TikTok match ad clicks with what happens on your site, making your reports more complete. It also feeds valuable data back to TikTok’s algorithm, helping you optimize for users who are more likely to convert.
>>> Read more: What is TikTok Pixel & How to set it up to optimize ad events?
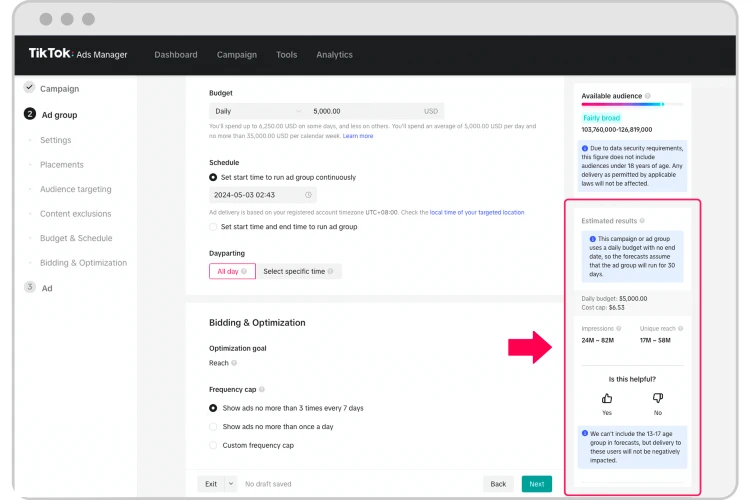
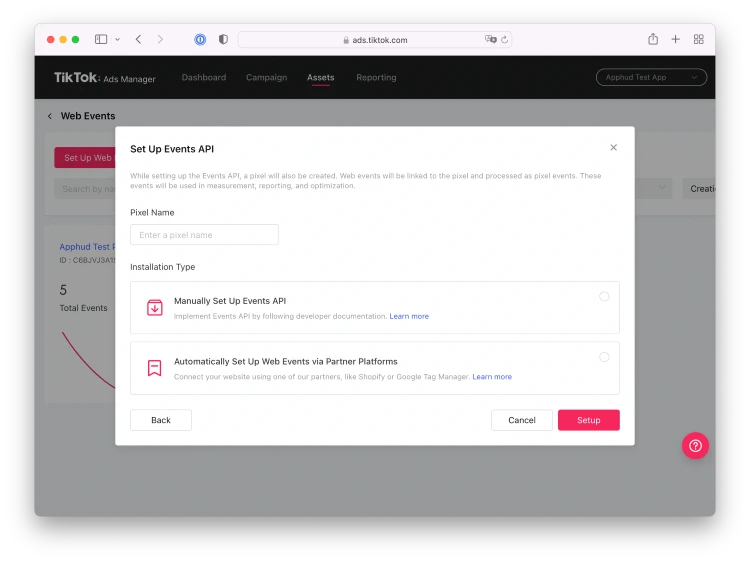
3. TikTok Events API
TikTok Events API works alongside or in place of the Pixel to track conversion events more accurately. Instead of relying on browser activity, it sends data directly from your server to TikTok. This reduces the risk of missed conversions due to ad blockers, slow-loading pages, or tracking restrictions.
Events API supports the same conversion metrics as the Pixel, such as:
- Purchases
- Add to cart
- Lead form submissions
- And other custom events
These events show up in TikTok Ads Manager just like Pixel events, helping you monitor key metrics like CVR, Cost per Result, and ROAS with higher reliability.
Why Your TikTok Ads Metrics Aren’t Showing? (& Quick Fixes)
If your TikTok Ads metrics aren’t showing up in the dashboard, don’t panic. Below are some common causes — and how to fix them fast:
1. Attaching Reach-based metrics
One popular reason why you can not view the TikTok ads metrics is that you have added Reach-based metrics!
First of all, reach-based metrics are comprised of:
- Reach
- Frequency
- Average watch time/person
- Cost/1000 people have reached
- Unique views on LIVE
Reach-based metrics count individual actions or people separately. So, you can’t just add them up for ads, ad groups, or campaigns. If you do, you might end up counting the same person or action more than once. To avoid this, TikTok Ads Manager removes duplicates when calculating these metrics.
Quick Fix:
- Go to the Campaign tab in TikTok Ads Manager, click on the metrics dropdown, and make sure the “Total of” section is checked. This ensures the platform displays totals across ad levels.
- Remove reach‑based metrics when viewing combined data. Instead, focus on aggregatable metrics like Impressions, Clicks, Conversions.
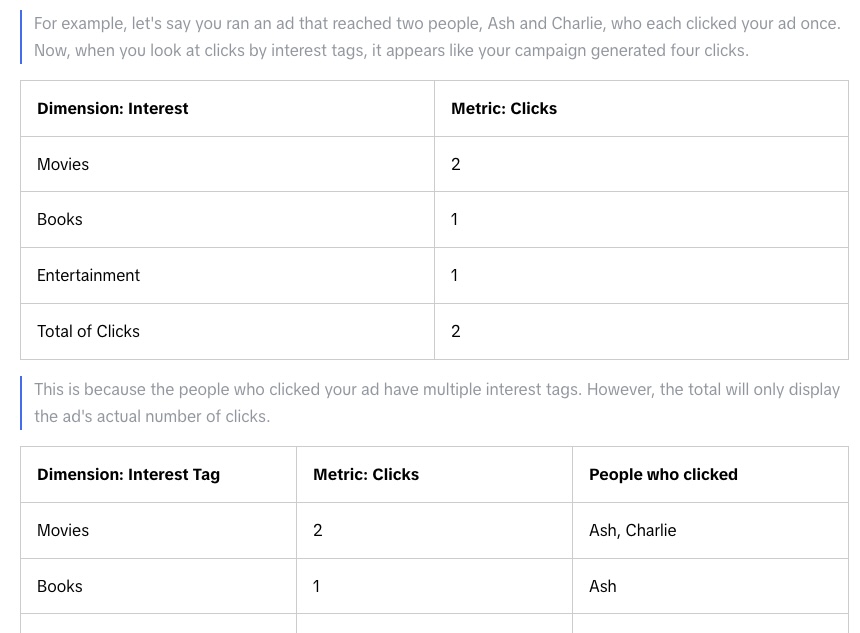
2. Using dimensions that identify users while adding metrics
When you study metrics based on characteristics like Interests, Behaviors, or Audiences, you must know that people can be part of more than one group at the same time. So, when the system counts the total number of metrics, it makes sure to avoid counting the same person multiple times by removing duplicates.
Quick Fix:
- Avoid overlapping dimensions when comparing raw totals.
- Or view metrics at the Ad Group or Ads level instead of Campaign.
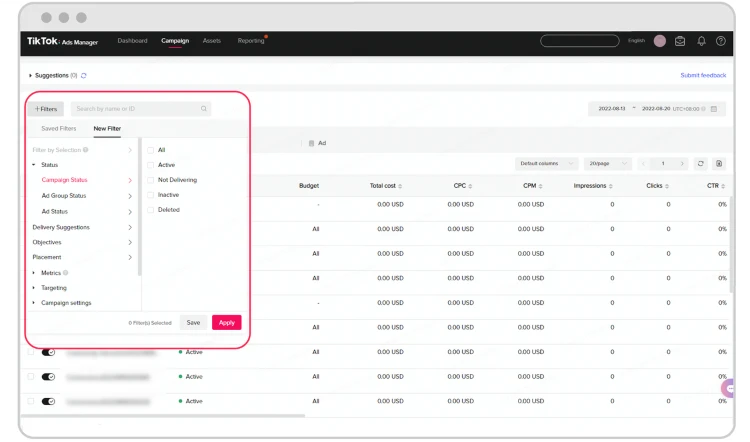
3. Deleted campaigns are not included in your total
Sometimes, the numbers you see for your ad groups or ads might not match when looking at different levels, such as Ad Group Level in comparison with Campaign Level. This might happen because the reports do not include data from ad groups or ads that have been deleted.
Quick Fix:
Go to the Filter menu, select “Ad Status” or “Ad Group Status,” and include Deleted to ensure all data shows.
Final words
TikTok Ads metrics are essential for advertisers to measure their advertising campaigns’ performance and effectiveness on the platform. Therefore, it’s crucial for creators and businesses to stay updated on platform changes, as TikTok’s KPIs may evolve over time.
If you come across any obstacles regarding TikTok ads or want to improve your optimization efforts, consider exploring TikTok Advertising 101 provided by Mega Digital – The top leading partner of TikTok! This crash course is designed for beginners aiming to bring their businesses to a new level on the TikTok platform.