Want to know if your business is ahead of the competition? Our Google Shopping ads benchmarks guide analyzes industry-specific data on key metrics such as average CPCs, CTRs, and conversion rates. Analyzing these benchmarks help you to gain insights into campaign performance, compare results to the averages, and identify chances for improvement.
About Google Shopping ads benchmark

Google Shopping ads benchmarks offer valuable insights into the performance and metrics of your ads. They provide information on metrics such as cost per click (CPC), click-through rate (CTR), and monthly budget, allowing you to compare and analyze your ad performance. This helps you make data-driven decisions and optimize your Google Shopping ads.
- CVR – Conversion Rate: The percentage of people who completed a desired action, such as purchasing after clicking on a Google Shopping ad. A higher CVR indicates that the ad and product page effectively converts clicks into sales.
- CPC – Cost per Click: The average cost a business pays each time someone clicks on their Shopping ads. This metric can help businesses determine how much they need to budget for their Google Shopping campaigns.
- CTR – Click-through Rate: The percentage of people who clicked on a Shopping ad after seeing it. A higher CTR typically indicates that the ad is more engaging and relevant to potential customers, which can lead to more conversions.
- CPA – Cost per Acquisition: A business’s average cost to acquire a new customer through their Google Shopping campaigns. This metric can help businesses determine the effectiveness of their ad spend and the profitability of their campaigns. Businesses can make data-driven decisions about optimizing their Google Shopping campaigns to maximize their ROI by analyzing their CPA.
Google Shopping ads benchmarks by industry
Below are details about Google Shopping ads benchmarks of these metrics by industry:
Cost per click (CPC)
The typical CPC (cost per click) varies based on the business industry. The most popular industries and their typical Google Ads cost per click are listed below:
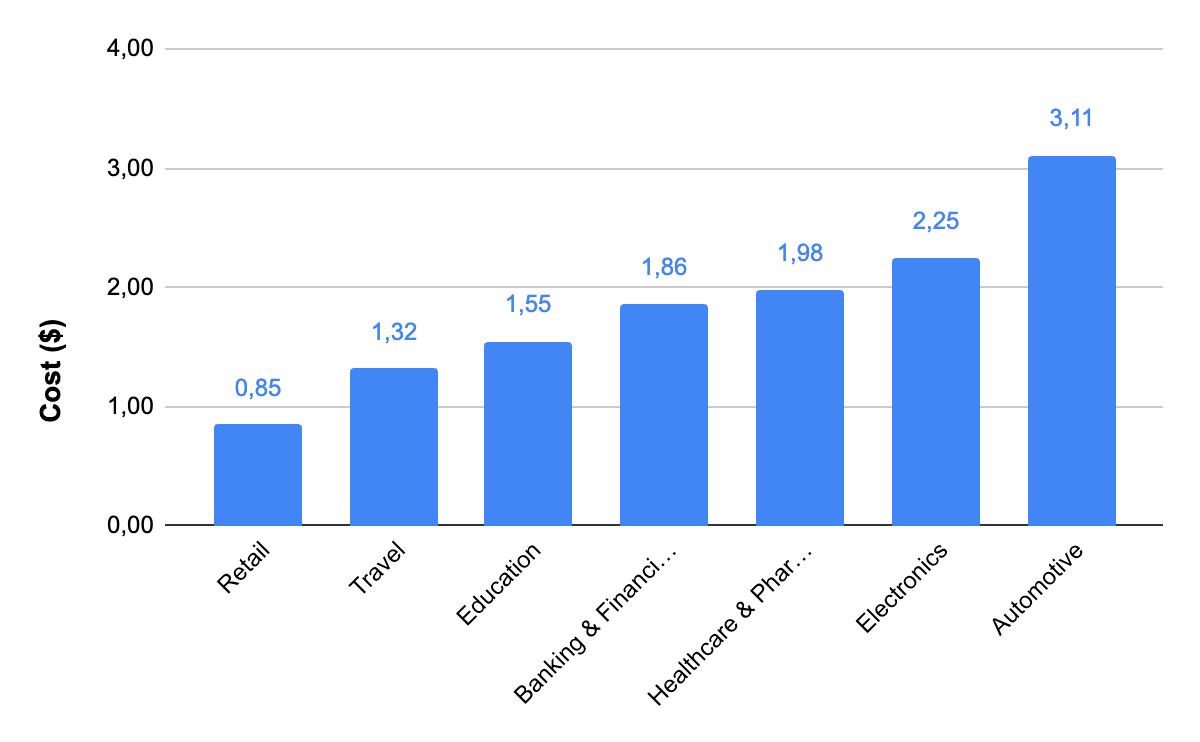
CPC on Google Ads varies by industry. Automotive has the highest CPC at $3.11, while retail has the lowest at $0.85. Factors like keyword competition and ad quality influence CPC. Analyzing industry-specific data helps determine the appropriate investment for competitive campaigns.
Conversion rate (CR)
Depending on the industry you’re in, different conversion rates apply. Here are some statistics on the most popular industries (retail, travel, education, banking & financial services, healthcare & pharmaceuticals, electronics and automotive) for driving traffic to Google Ads and their typical conversion rates:
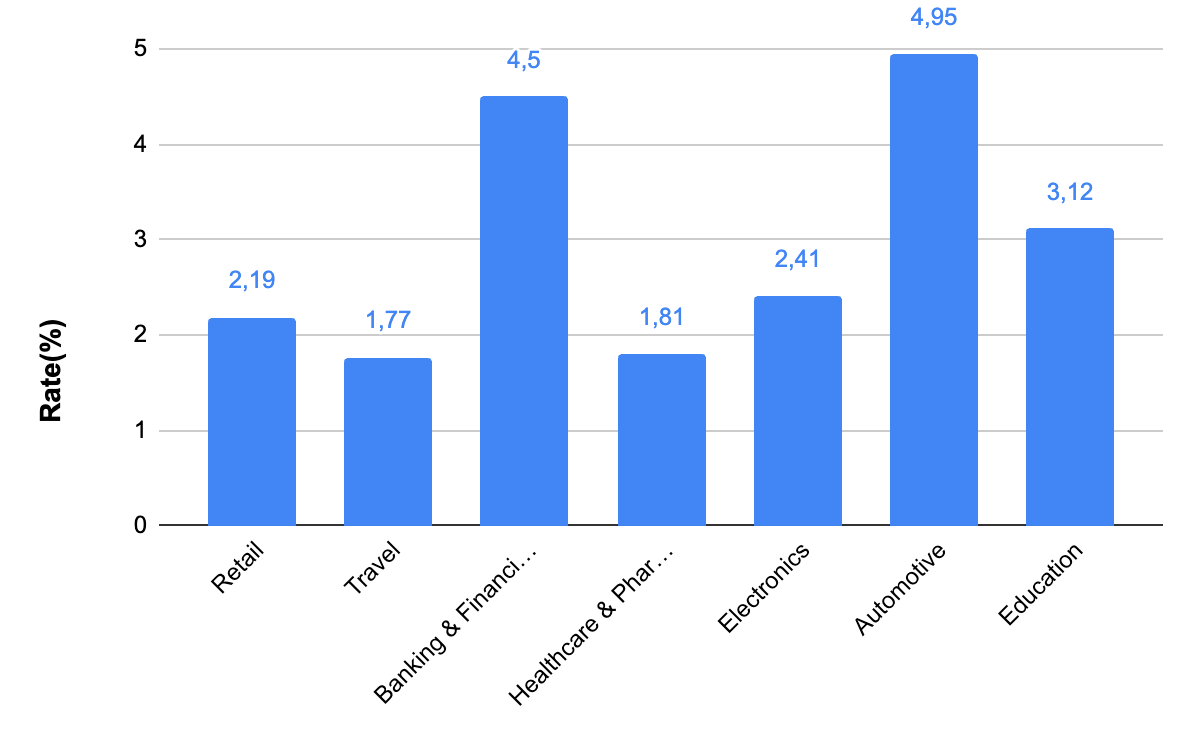
Conversion rates vary across industries. Retail and Electronics have average rates of 2.19% and 2.41%, while Education and Automotive have higher rates at 3.12% and 4.95%. Banking & Financial Services have the highest rate at 4.50%. Use these benchmarks to optimize your campaigns and achieve better results.
Click-through rate (CTR)
According to the industry, the average CTR differs. The most popular businesses and their typical search ad CTRs are listed below:
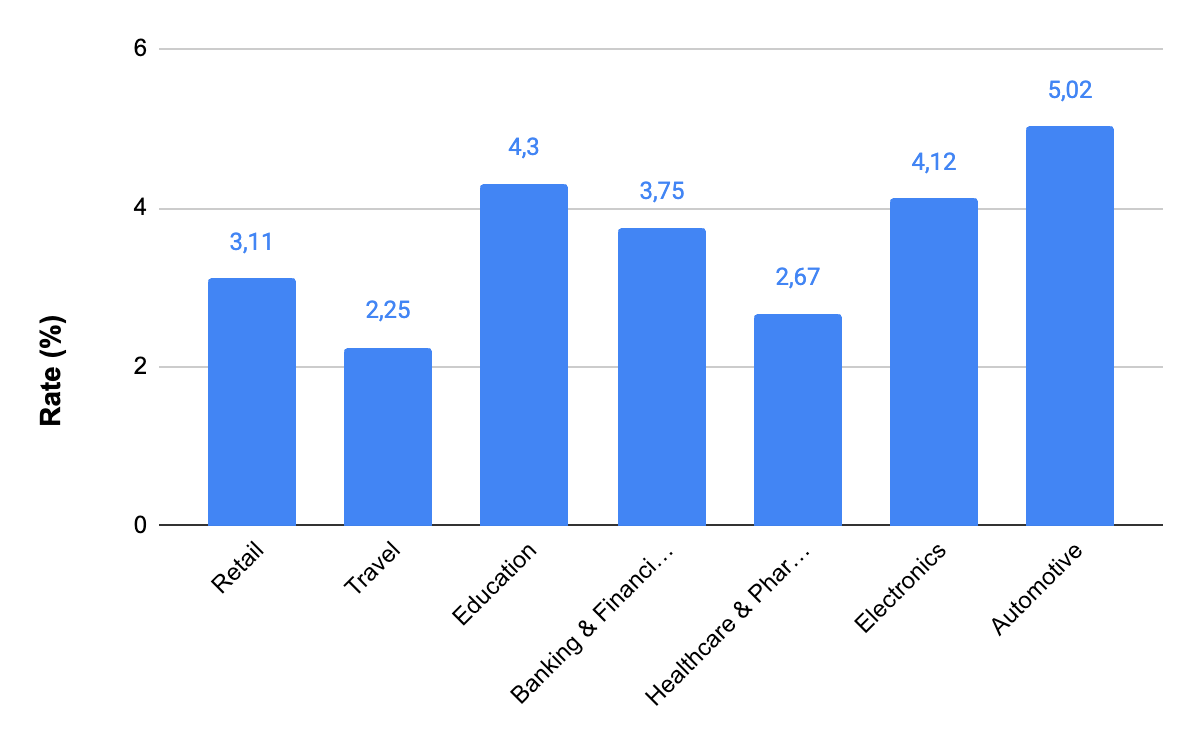
CTR in Google Ads reflects ad effectiveness, but factors like ad copy, targeting, and bidding impact it. Average CTRs across industries offer performance context. Automotive has the highest CTR at 5.02% due to competition, while healthcare and pharmaceuticals have the lowest at 2.67% due to sensitivity. Understanding industry benchmarks helps set expectations and optimize campaigns for success.
Cost per action (CPA)
The average CPA cost per action also varies depending on the industry. The Google ads CPA across all industries is $56.11 on the Search Network. Here are some data on the latest Google Shopping ads benchmarks for CPC:
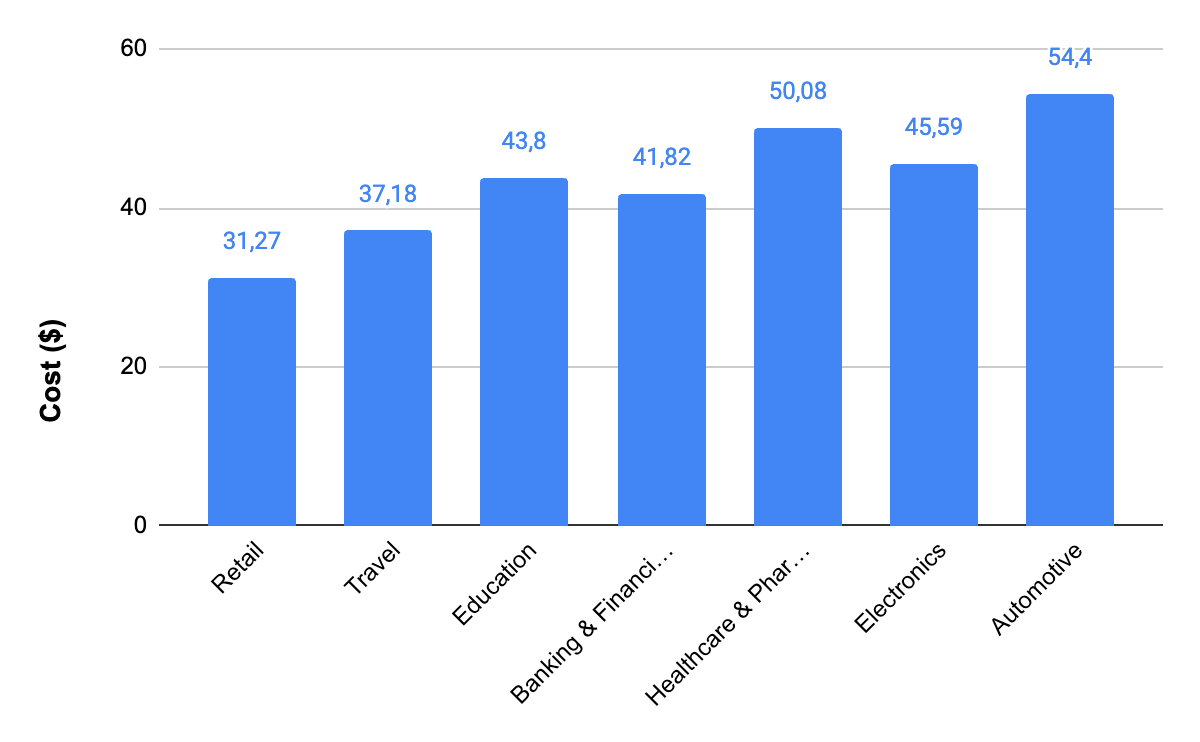
CPA in Google Ads varies by industry. The average CPA on the Search network is $56.11, ranging from $31.27 in retail to $54.40 in automotive. Knowing industry benchmarks helps set advertising budgets and estimate acquisition costs.
CPA is affected by factors like ad quality and targeting. Optimizing campaigns and improving these elements lowers CPA. Monitoring and adjusting your ad strategy ensures efficient budget allocation.
Google Search ads benchmarks
Google Search ads benchmarks provide valuable insights into the performance of your advertising campaigns. By understanding these benchmarks, you can gauge the effectiveness of your ads and make informed decisions to optimize your campaigns.
Search ads CPC
Search advertisements’ typical CPC varies depending on the industry. The most popular industries and their typical CPC for Search ads are listed below:
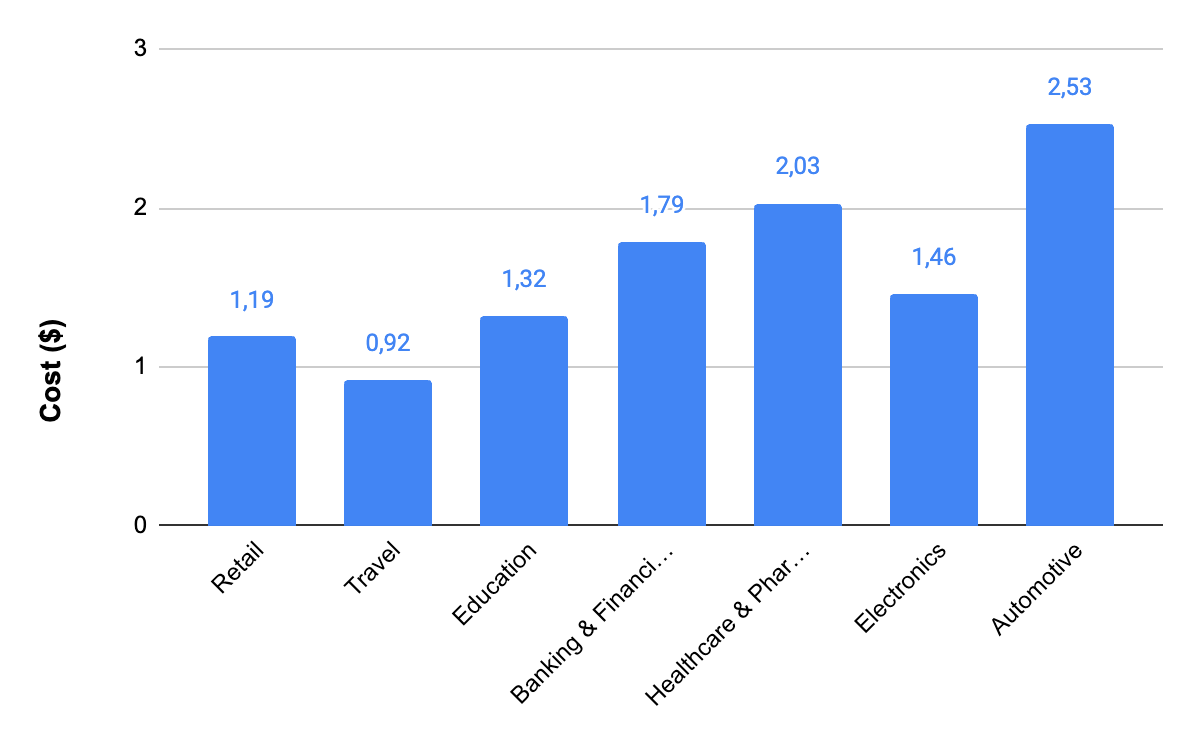
CPC for Search ads varies across industries. Healthcare and automotive have the highest CPCs at $2.03 and $2.53, while travel has the lowest at $0.92. Factors like competition, keyword popularity, and search volume contribute to these differences. Understanding industry variances helps plan ad budgets and adjust CPC bids for competitiveness and ROI optimization.
>>> Read more: What is Google Ads ROI: Ways To Calculate and Improve Your ROI
Search ads CR
The conversion rate is a key metric to assess the success of your Search ads campaign, as it measures the percentage of clicks that lead to a desired action, such as a purchase or a form submission. However, the average CR can vary significantly depending on the industry, as shown by the following data on some of the most common sectors:
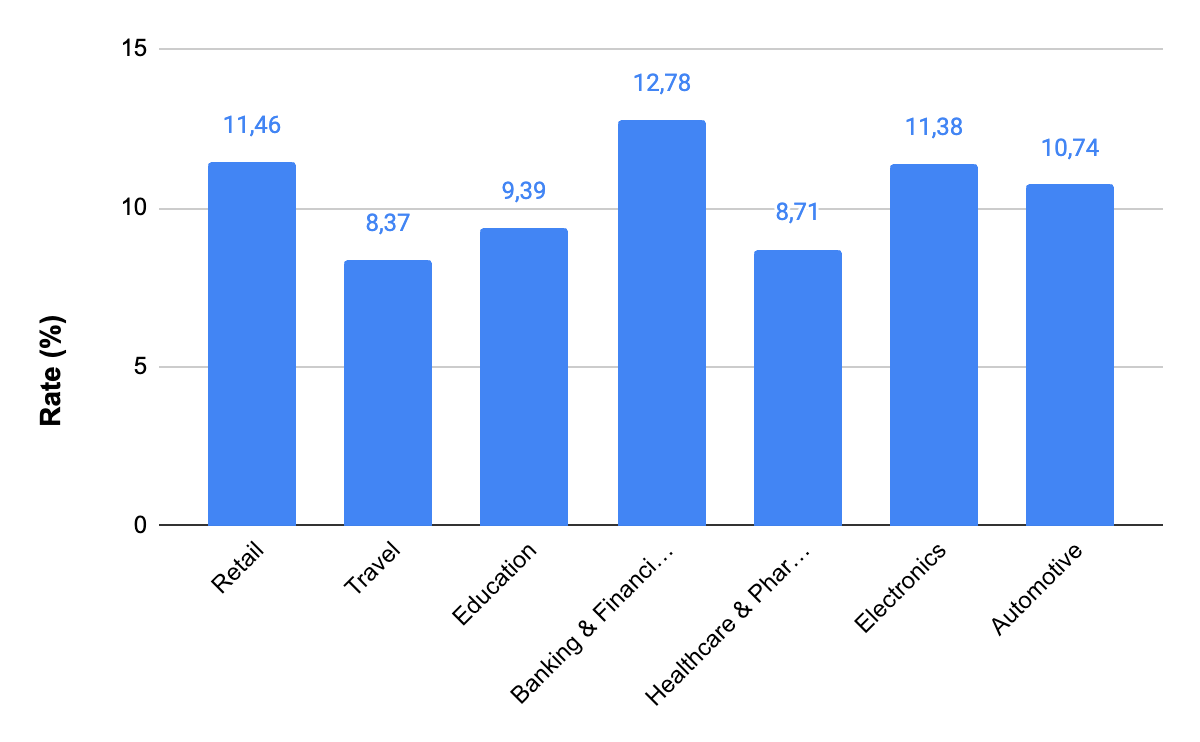
Conversion rates vary by industry and are crucial benchmarks to evaluate campaign effectiveness. Banking and financial services aim for a CR of 12.78%, while the travel sector considers 8.37% good. However, a high CR may not always be better and could indicate targeting or landing page issues. Tracking CR with metrics like CPC and CPA ensures profitable outcomes from search ads.
>>> Read more: Most Important Google Ads Metrics You Need to Track Daily
Search ads CTR
The CTR is another important metric to consider when measuring the success of your Search ads campaigns. It represents the percentage of users who clicked on your ad after seeing it:
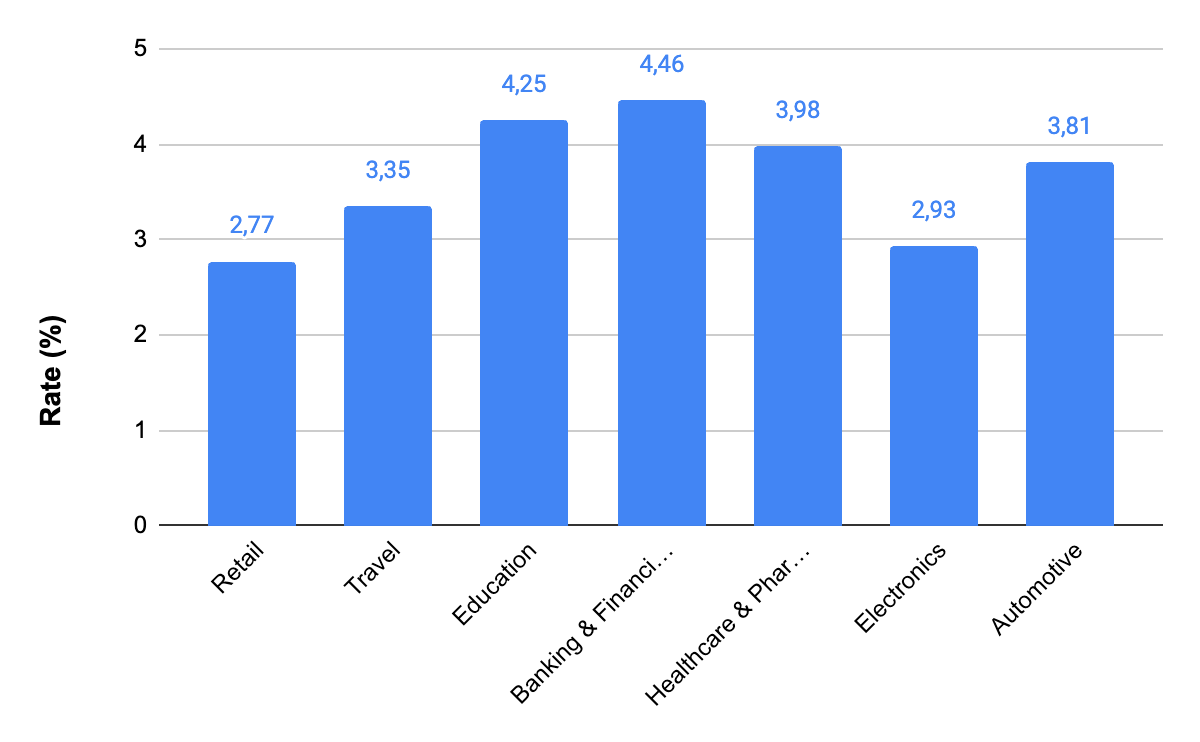
Factors like ad relevance, position, format, and extensions influence CTR. Engaging content and higher positions lead to more clicks. Ad extensions provide additional context and increase CTR. Review and optimize ad relevance, position, format, and extensions to improve CTR.
Search ads CPA
The typical CPA for Search ads varies by industry. Here are some examples of industry-typical CPAs for Search ads:
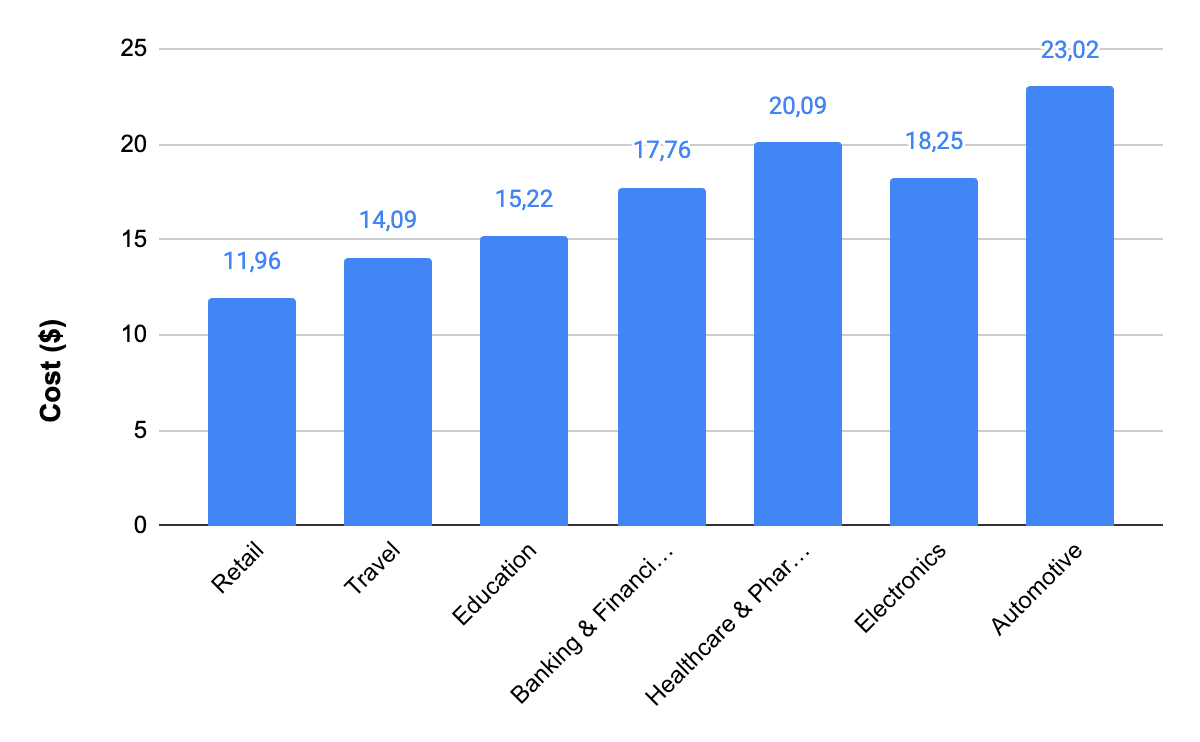
The average cost per action (CPA) for search ads reveals industry competitiveness. Higher CPA rates in industries like Healthcare & Pharmaceuticals, or Automotive may indicate greater ROI potential due to valuable leads. Lower CPA rates in industries like Retail or Travel may result from higher competition and lower lead value. Consider industry context and potential ROI when setting CPA bids for your campaigns.
Google Display ads benchmarks
Google Display ads benchmarks offer valuable insights into the performance of your advertising campaigns. These benchmarks provide a way to maximize the effectiveness of your ads and make informed decisions to optimize and enhance your campaigns.
Display ads CPC
Each industry has a different average CPA for Display ads. Here are some instances of standard CPAs for Display ads on the market:
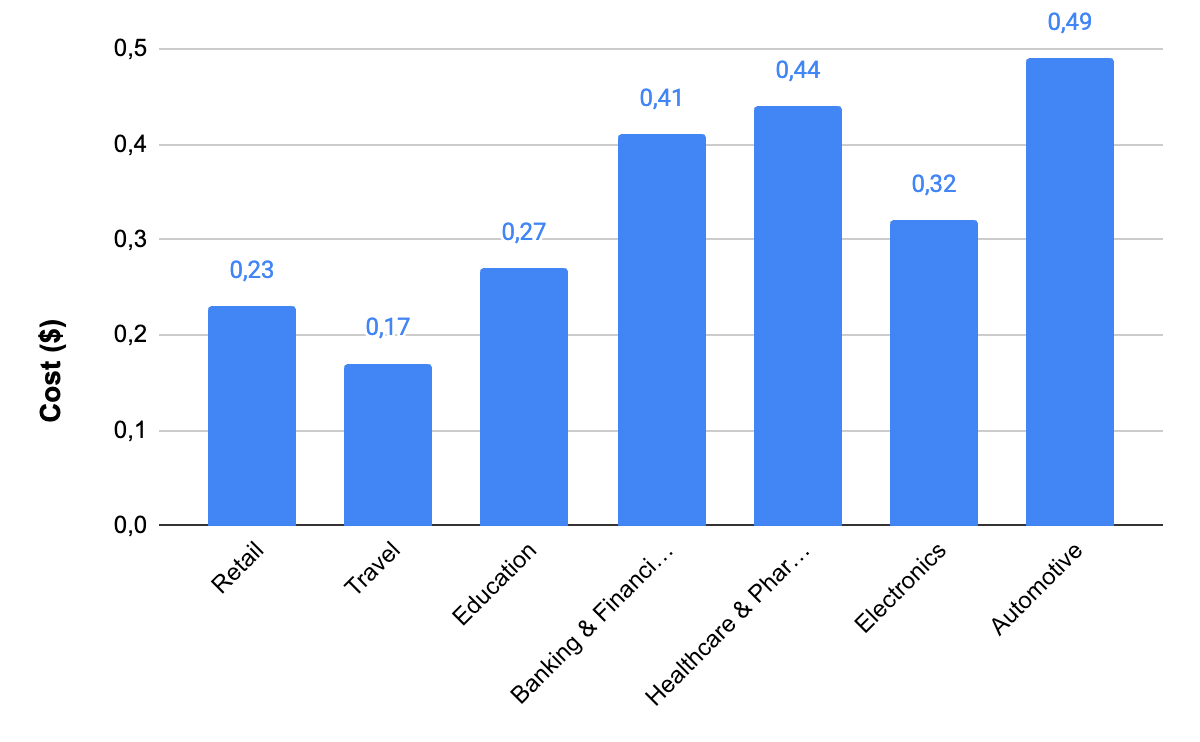
The CPC for Display ads is an essential metric for campaign planning. Understanding industry averages helps set realistic budgets and expectations. Retail has the lowest CPC at $0.23, while automotive has the highest at $0.49. Knowing your industry’s average CPC guides budgeting and bidding strategies. Monitoring CPC and adjusting bids optimize campaigns and reduce the overall cost per conversion.
Display ads CR
The average CR for Display ads also varies depending on your industry. Here are some of the most common industries and their average display conversion rates for ads:
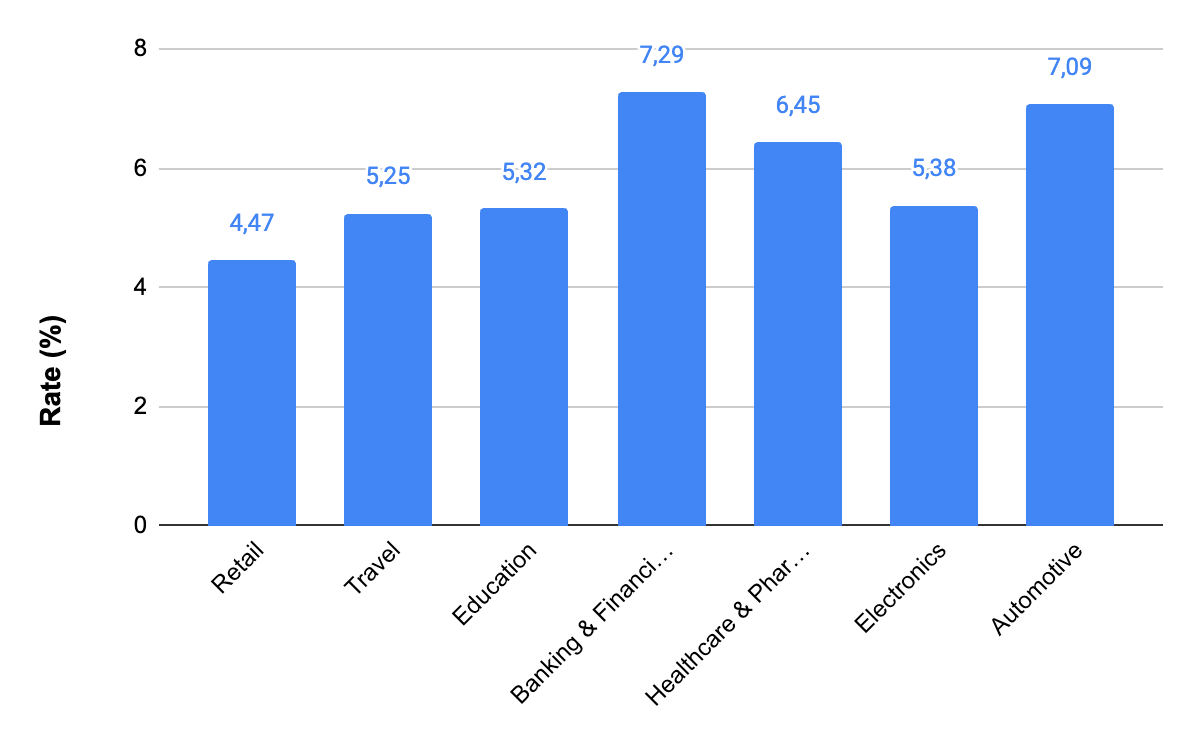
Conversion rates for display ads vary by industry, with Banking and Financial Services having the highest CR at 7.29%. Automotive, Healthcare & Pharmaceuticals also have strong CRs. Retail and Electronics have lower CRs. Education maintains a solid CR at 5.32% despite a high CPA, reflecting engagement. Striving to exceed the industry average is a key goal for marketers.
Display ads CTR
Depending on your industry, the typical CTR for Display ads differs as well. The most popular industries and their typical CTRs for Display ads are listed below:
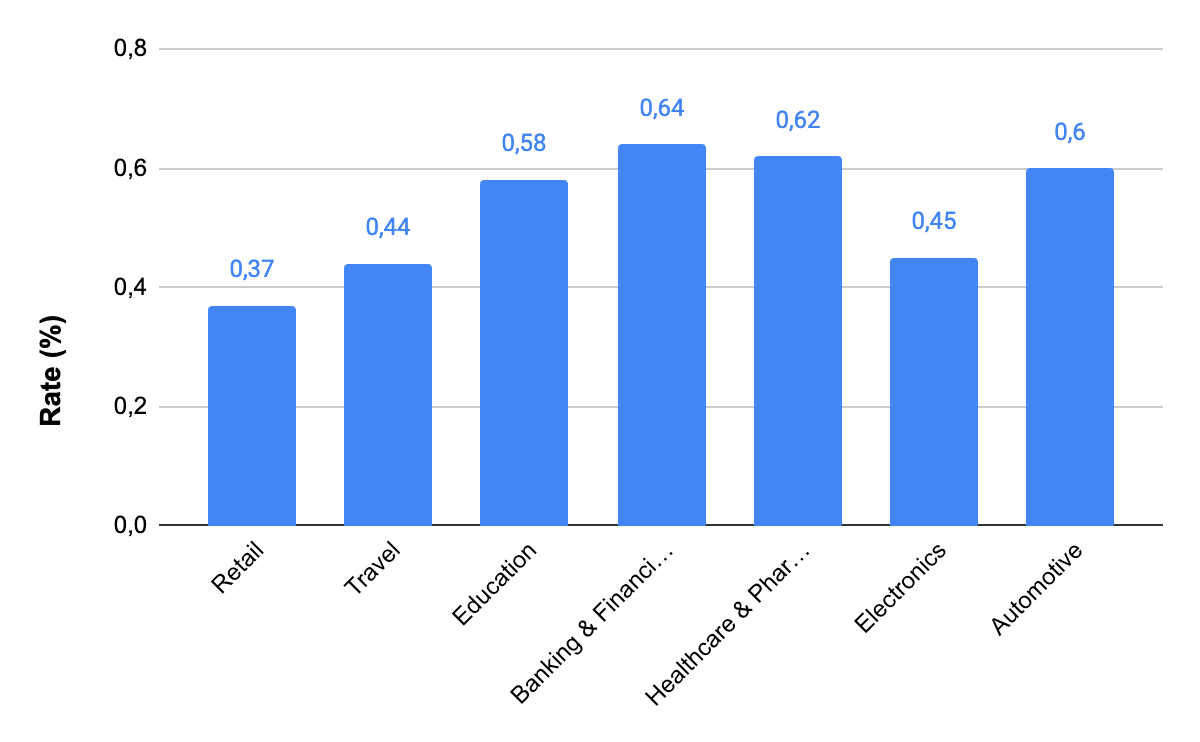
The average CTR for Display ads varies by industry, with education having the highest CTR at 0.58% and retail the lowest at 0.37%. These benchmarks help evaluate ad performance. However, a high CTR doesn’t guarantee conversions; conversion rate is another vital metric. Likewise, a low CTR may indicate targeting issues. Optimize Display ads with proper audience targeting and message alignment.
Display ads CPA
The average CPA for Display ads varies depending on your industry. Here are some of the most common industries and their highest average CPA for Display ads:
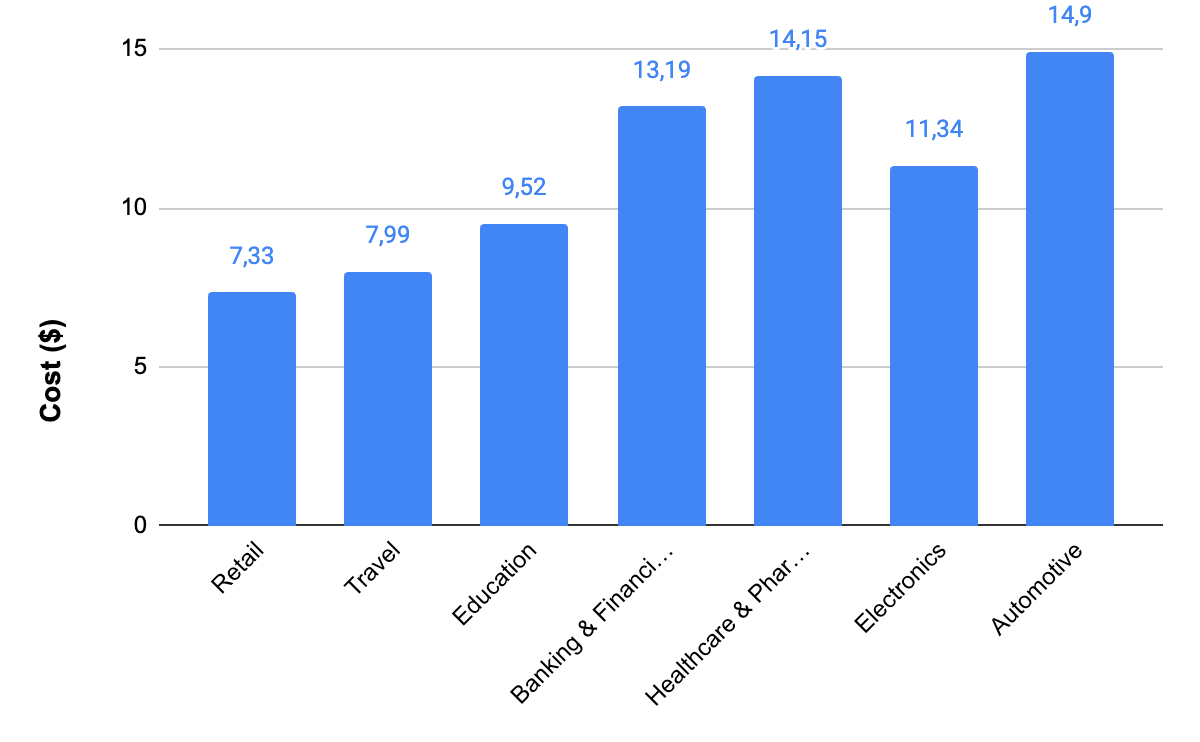
The average CPA for Display ads varies by industry, with the automotive industry having the highest at $14.90 and retail having the lowest at $7.33. This indicates the cost of acquiring customers or leads through Display ads. Advertisers can use these benchmarks to evaluate the cost-effectiveness of their campaigns and make necessary adjustments.
Google Shopping ads benchmarks
Gain valuable insights into the performance of your advertising campaigns. Evaluate the effectiveness of your ads and make informed decisions to optimize and enhance your Google Shopping ads campaigns.
Shopping ads CPC
The average CPC for Shopping advertisements varies depending on your industry. The following are some of the most common sectors, as well as their average CPCs for Shopping ads:
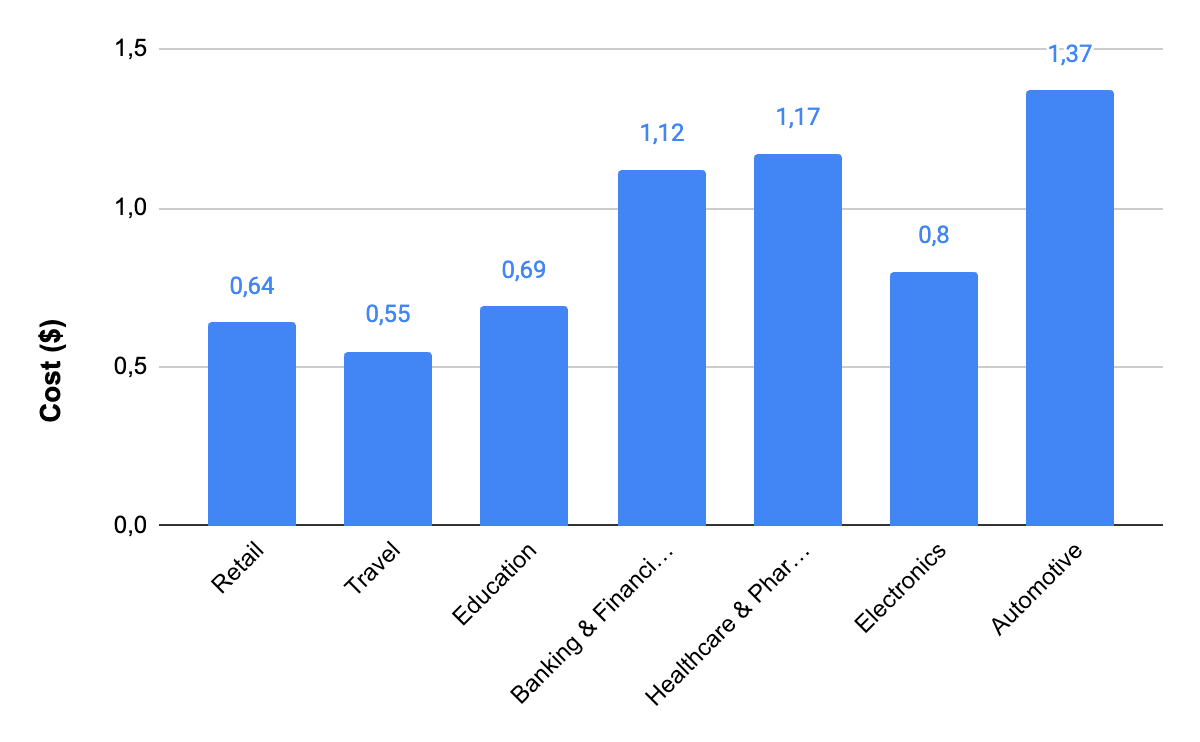
CPCs for Shopping ads vary by industry. Retail and travel industries have lower CPCs at $0.64 and $0.55, while automotive, banking, and financial services industries have higher CPCs at $1.37 and $1.12. Strategic bidding and targeting are vital for maximizing ROI in high CPC industries, while lower CPC industries may allow for increased budget allocation. Competition and ad quality impact CPC effectiveness.
Shopping ads CR
Shopping ads’ average CR also varies depending on your industry. The highest conversion rates for Shopping ads are in the Banking & Financial Services industry, with an average conversion rate of 6.05%. Here are some of the most common CR for Shopping ads:
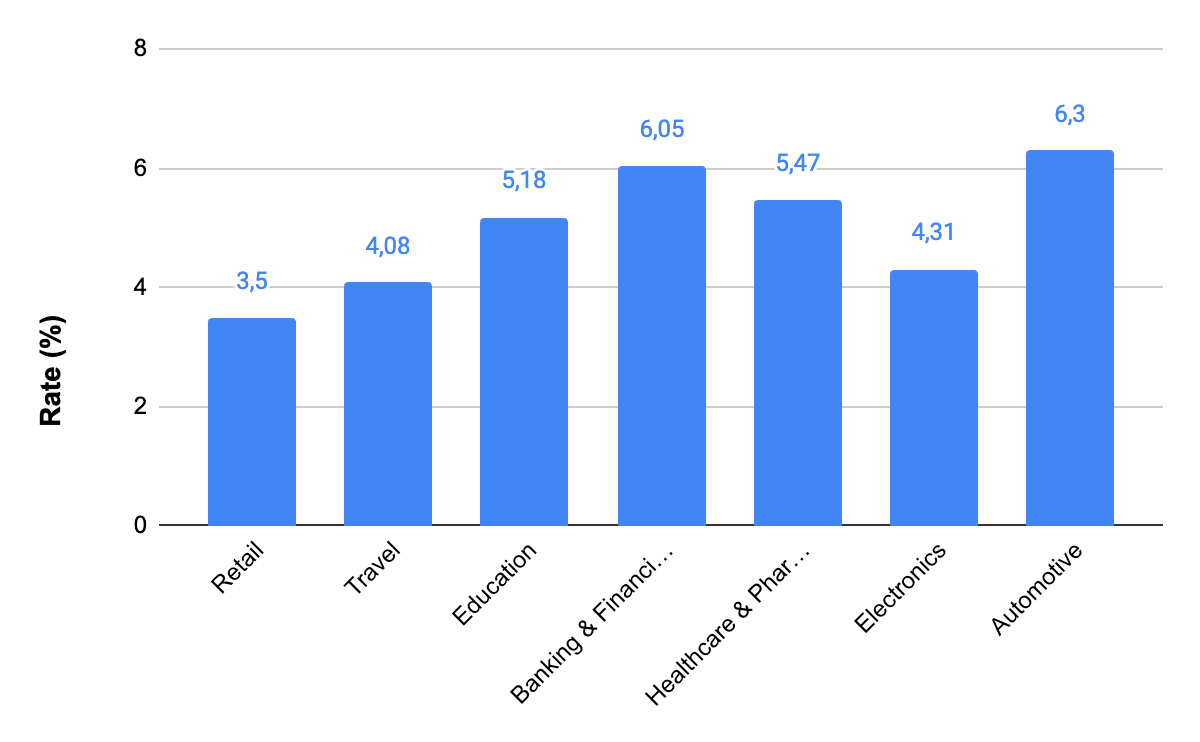
Conversion rates in Shopping ads vary by industry. Banking & Financial Services have the highest average conversion rate at 6.05%, while Retail and Travel industries range from 3.5% to 4.08%. Comparing your rates to industry averages helps assess performance. Adjusting campaigns and landing pages can improve below-average rates. Higher rates may indicate successful campaigns and may justify the increased budget allocation. Being aware of industry benchmarks and leveraging them in advertising strategies is crucial.
Shopping ads CTR
Depending on the industry you work in, the typical CTR for Shopping ads differs as well. The most popular industries and their typical CTRs for Shopping ads are listed below:
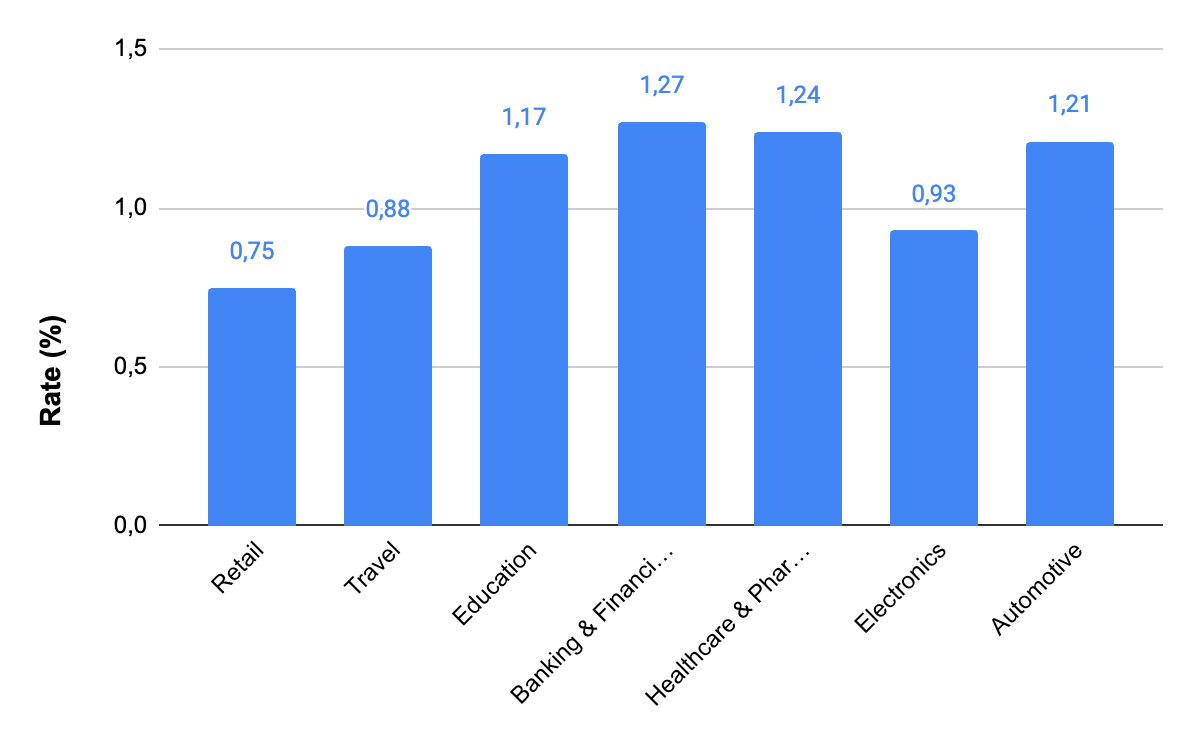
To measure the success of a paid advertising campaign, analyze metrics like CTR, CPC, CPA, CVR, and other KPIs together. The Education industry has a CTR of 1.17%, Banking & Financial Services at 1.27%, and Retail at 0.75%. However, it’s crucial to consider CTR alongside CPC, CVR, and CPA for a comprehensive assessment. Use these benchmarks to adjust your ads, targeting, and bidding strategies to improve performance. If CTR or CVR is low, reassess your approach. Optimize bidding and targeting for better ROI if CPC or CPA is high. Make data-driven decisions to run effective campaigns.
Shopping ads CPA
The average CPA for Shopping advertisements varies depending on your sector. The following are some of the most common industries, as well as their average CPL for Shopping ads:
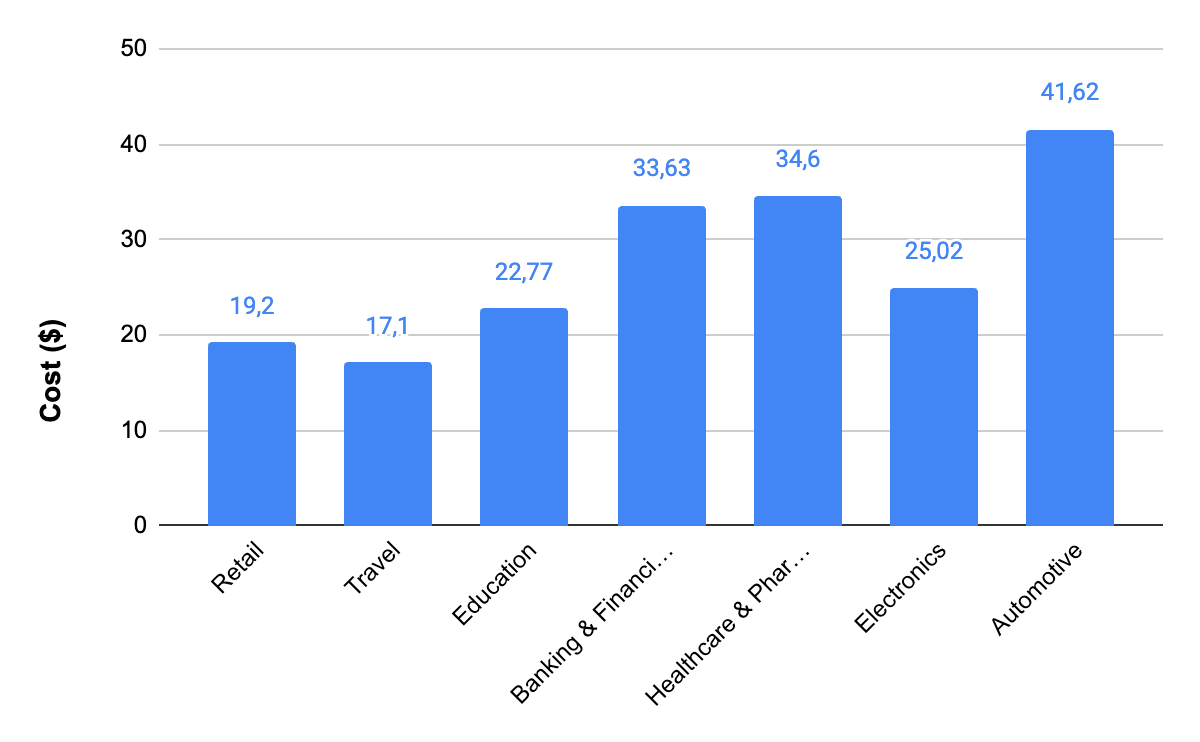
The average cost per lead (CPL) for Shopping ads varies by industry, with retail having the lowest average CPL at $19.20 and automotive having the highest at $41.62. Businesses can use these benchmarks to allocate their advertising budget and gauge competitiveness. Optimizing Shopping ads campaigns can help lower CPL and improve ROI.
How to use these Google Shopping ads benchmarks
Here are a few ways to use these benchmarks to your advantage:
Comparing campaign metrics against industry averages
By analyzing your campaign metrics against industry benchmarks, you can identify areas requiring improvement and determine if your performance lags behind the competition. For example, if your conversion rate is lower than the industry average for your vertical, you may need to refine your targeting or ad copy to improve your conversion rate.
Identifying and addressing weakness
Regular audits of your campaigns can help you pinpoint areas of weakness and opportunities for improvement. For instance, if your ads have a low CTR, it may be due to poorly written ad copy or a lack of compelling ad extensions. Identifying and addressing these issues can help improve your CTR and drive more clicks and conversions.
Setting realistic goals using industry benchmarks
Setting realistic goals for your campaigns based on industry benchmarks allows you to establish clear performance targets that align with your overall business objectives. This can help you track your progress over time and measure the impact of your PPC efforts on your business’s bottom line.
Tracking industry trends
Keeping a close eye on industry trends can help you make more informed decisions about your PPC campaigns, including audience targeting, budget allocation, and campaign strategy. For example, if you notice that your competitors are investing heavily in a particular ad format or channel, it may be worth exploring that channel for your own campaigns.
Final words
In summary, understanding Google Shopping benchmarks is important for businesses looking to stay competitive. By analyzing their performance metrics and comparing them to industry standards, businesses can identify areas for improvement and optimize their campaigns for maximum success.
