

You’ll encounter a lot of figures and metrics when working with Google Ads (formerly known as Google AdWords). This can be irritating and intimidating for a newcomer, but in this article, Mega Digital will give you an overview of the 10 most essential Google Ads performance metrics for a successful campaign.
Quick summary:
- Tracking the right advertising metrics prevents budget waste and maximizes your overall return on ad spend
- Return on Ad Spend and Conversion Rate stand out as the most critical indicators of actual profitability
- Connecting your ad account with Google Analytics 4 is now a strict requirement for accurate data tracking and machine learning optimization
- Understanding the context behind the numbers matters much more than looking at isolated figures
What are the metrics in Google Ads?
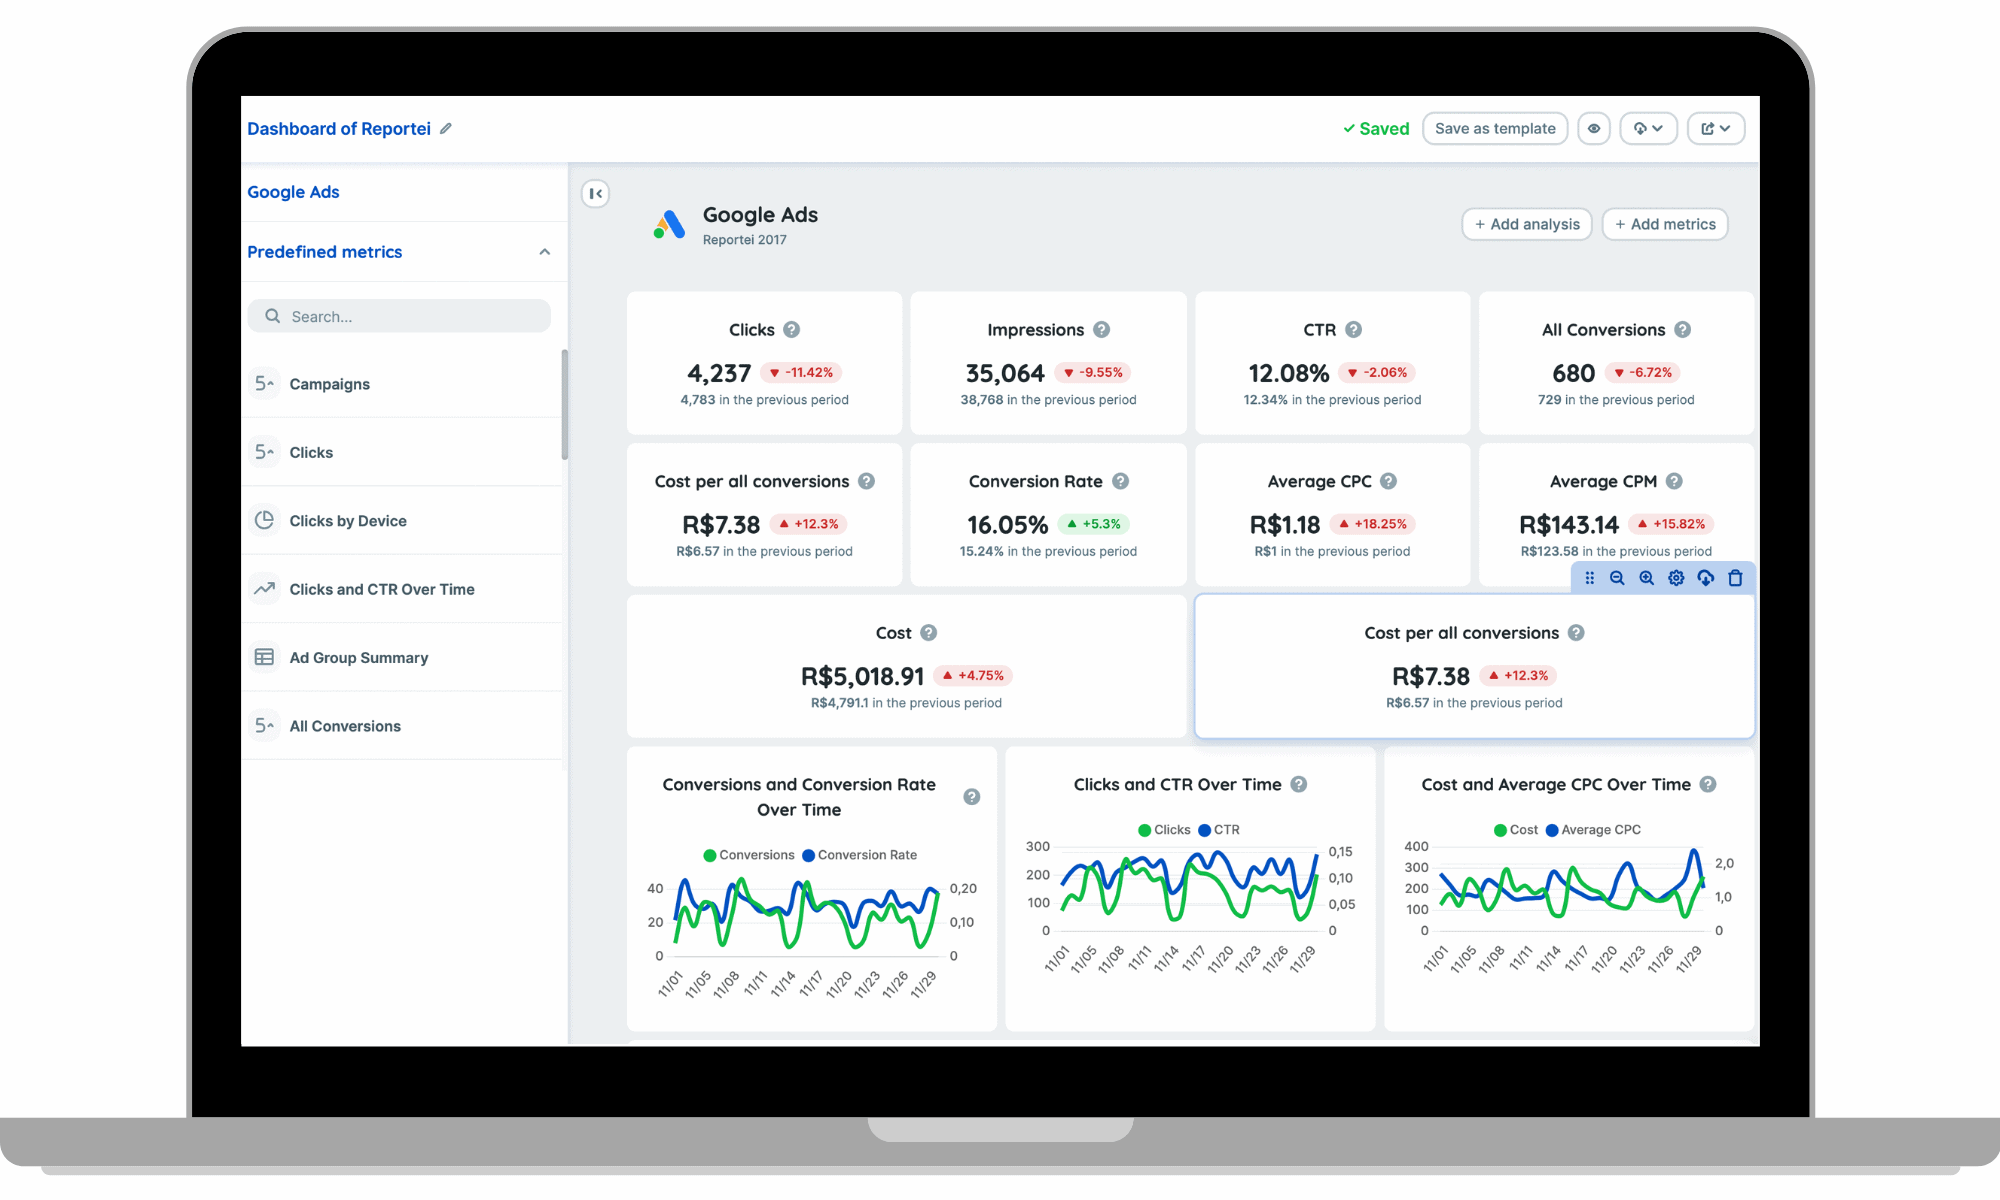
Advertising metrics are indicators to monitor performance and are essential for measuring campaign success. The most effective metrics vary significantly from campaign to drive, but generally, they track how your campaign affects audience behavior. Let’s look at the Google Ads metrics definitions:
Google Ads metrics provide you with information about your ad performance and recommendations for what to do next. By that, you can monitor them to see whether your campaigns succeeded.
There are numerous metrics in Google Ads, from impressions to conversions and everything in between. These indicators, such as CPCs, CPAs, and Quality Score, can enhance ROI and optimize Google Ads campaigns. Others, such as Budget Limits or Impression Share, on the other hand, exist purely to persuade your agency that your customer needs to spend more on Google Ads (even though occasionally, you don’t).
How to measure Google Ads performance?

Always begin by outlining the main objective of your advertising. This objective is mostly about your financial situation, raising brand awareness can help by increasing sales and overall revenue. You must first establish this purpose to choose the metrics to use when assessing your Google Ads campaigns.
Data is the foundation of Google Ads. You must evaluate and interpret the data you receive to maintain your performance at a high level. To meet the patterns from your Google Ads data analysis, you must modify your Google Ads account, including Google search queries, ad copy, and negative keywords. You must alter your setup countless times to attract searchers’ interest.
If you’re a beginner, start by studying the essential metrics listed below, then customize it over time by making adjustments.
Google Ads metrics list you should monitor
Based on our customers’ paid search metrics, Mega Digital presents you with the 10 most important Google Adwords metrics.
10 basic Google Ads metrics for beginners
1. Return on Ad Spend (ROAS)
Return on Ad Spend is one of the first metrics we should look at to understand current PPC performance. The cost-to-revenue ratio for our Google Ads is known as the ROAS.
Take the campaign’s revenue, and divide it by the cost of advertising to determine ROAS. You will receive a ROAS as a result.
The ROAS formula: ROAS = Revenue/Total cost
(Revenue: Conversion value
Total cost: Price + Advertising cost)
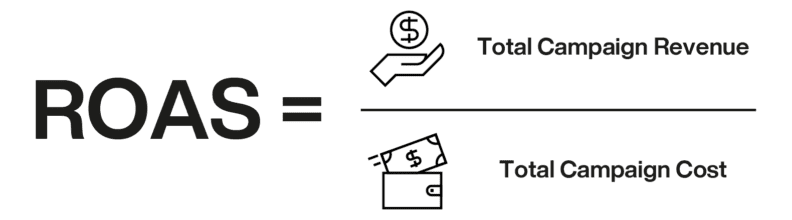
Example:
Total Cost: $500
Revenue: $2000
ROAS = 4
(2000/500 = 4)
ROAS is the amount you receive back for each dollar spent on Google Ads. You earn $4 every time you spend $1 on Google Ads, thanks to your ROAS of 4. The effectiveness of the advertising strategy increases with the return.
Industry benchmark: Google Ads generated a ROAS of 3.68 in 2025 among more than 18,000 e-commerce brands analyzed by Triple Whale, equivalent to $3.68 in attributed revenue for every $1 spent on advertising.
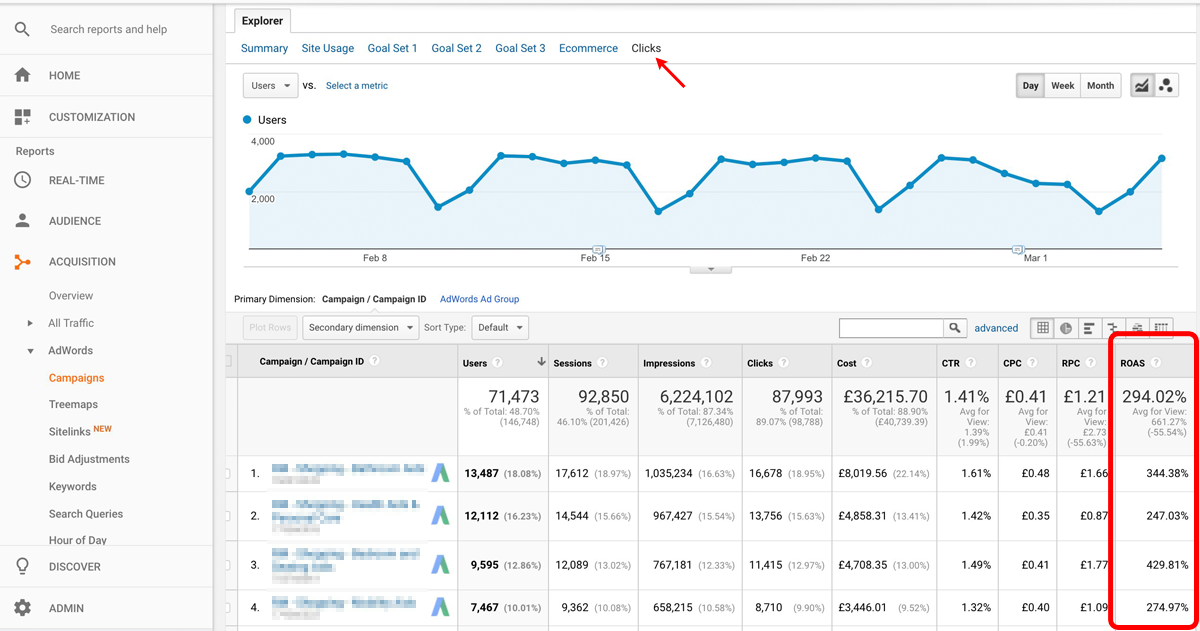
Spending less on your ads is a straightforward approach to increasing ROAS. But there are several strategies to prevent less money from leaving the building. Here are some strategies to cut your advertising expenses:
Test your bidding strategy:
- Manual bidding: You can modify your maximum bid with manual or enhanced costs per click (CPC).
- Automated bidding: You may set up automated bids in various ways to support accomplishing particular ad objectives.
Aim for a lower position in SERP: The third position will cost less, still be on the first page, and above the fold.
Target the right audience: Identifying and segmenting your audience can help you spend less on advertising.
Pay attention to keywords: Selecting and using the right keywords to increase ad relevance.
2. Return on Investment (ROI)
ROI is how much money you’ve gained from your free product listings and advertisements compared to your spending on them.
Take the money from your advertisements and listings, deduct your overall costs, and then divide by your overall costs to determine ROI:
ROI = (Revenue – Cost of goods sold) / Cost of goods sold.

Example:
You’re advertising to sell a $100 product for $300. Due to your Google Ads campaign, you sold five of them, so the total sales are $1500. The products cost $500 to produce. You spent $500 for advertising; this is how you would enter these figures into the ROI formula:
ROI = ($1500 – ($500+$500)) / ($500+$500)
= ($1500 – $1000) / $1000 = $500 / $1000 = 0.5, or 50%
Multiply 0.5 by 100 to convert it to a percentage. Since your Google Ads ROI in the example was 50%, you made $1.50 for every dollar you spent.
3. Cost
The overall metric “cost” in Google Ads lets you know how much money you’ve already spent on your advertising campaign.
Cost per click (CPC)
You give Google a particular sum of money each time someone clicks on your advertisement. The term for this is the cost per click or CPC. A well-optimized campaign should decrease cost per click over time, making CPC an intriguing indicator.
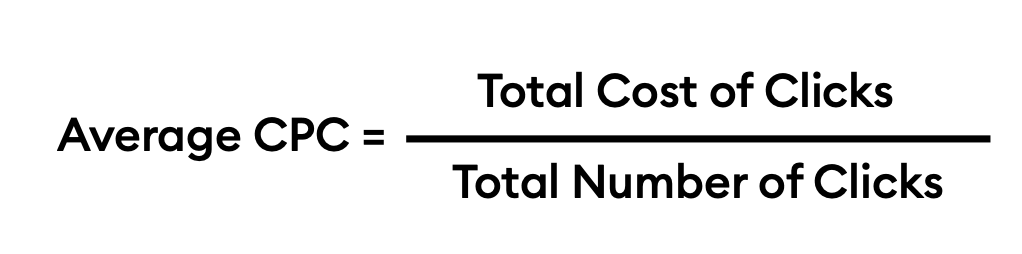
By dividing the cost of your clicks by the total number of clicks, you may determine your average cost per click. Here is the CPC equation: Total spent/Number of clicks = Average cost per click
Example:
Total spent: $100
Number of clicks: 500
CPC = 100/500 = 0.2
Your average CPC = $0.2
Market insight: The average cost per click in Google Ads reached $5.42 in 2026, up from $5.26 in 2025.
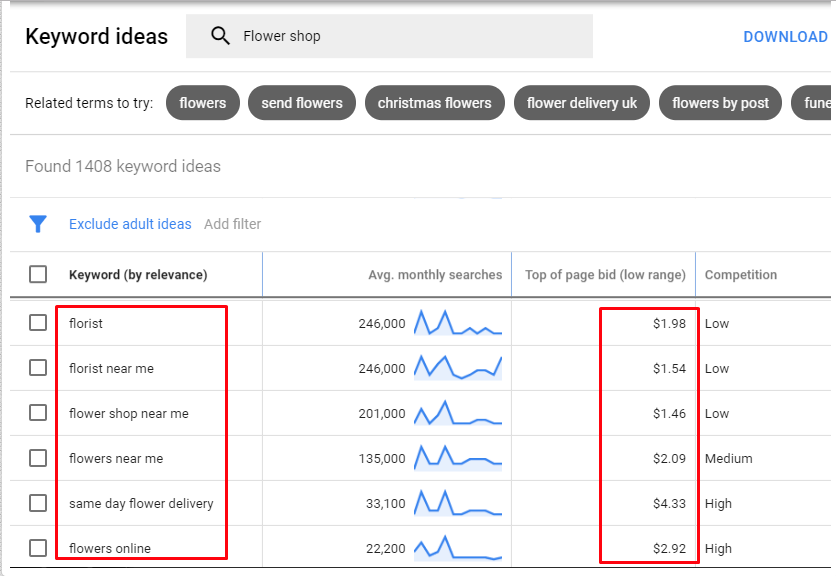
But how is the cost per click determined? Three factors primarily determine the CPC of your adverts:
- Maximum bid: You place a bid that reflects the highest price you are prepared to pay for each click on your advertisement.
- Quality Score: A judgment about the caliber of your landing pages, keywords, and adverts. It is rated on a scale of 1 to 10.
- Ad Rank: The factor Google Ads considers when deciding where to place an ad on the SERPs.
Average cost per action (CPA)
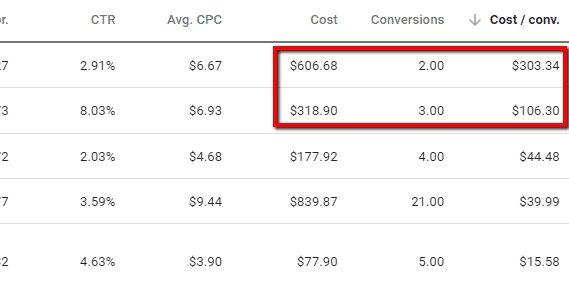
The CPA metric, called cost per acquisition, calculates how much cash is required to convert a user.
Cost per action = Total spent/Number of actions

Example:
With the above calculated $0.2 CPC and 50 out of the 500 clicks made an action.
CPA = 100/50 = 2
Your CPA is $2.0
What then qualifies as an action? Any aspiration you have is an action. For an online store, an action might be when a customer makes a purchase. Completing a specific sign-up form by a visitor also constitutes an activity for a company that provides B2B services.
As you would have anticipated, the CPA is typically higher than the CPC. You must get the user to click on your advertisement before asking them to take further action.
4. Impressions
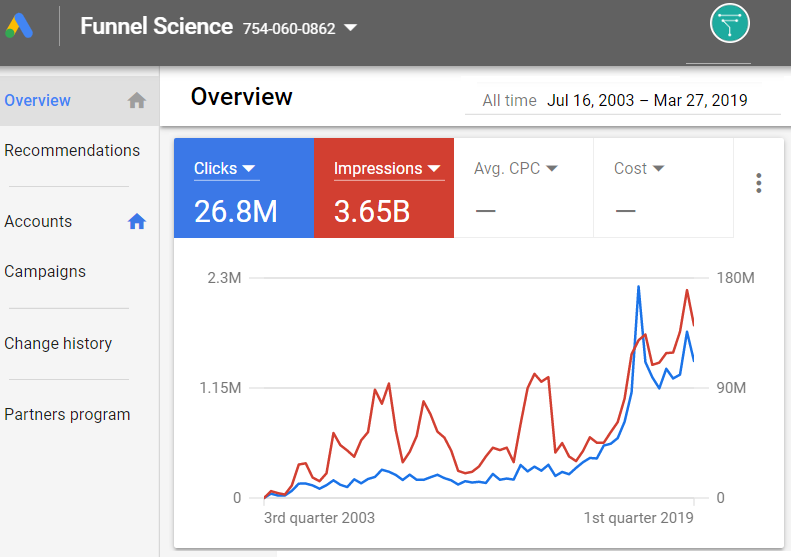
One “impression” of your ad is recorded by Google Ads whenever it appears on a search result page via Google or the Google Network.
Essentially, it’s the number of times your ad is “seen”; however, this phrase should be used loosely since a user may not have viewed it merely because it appeared on a search result page.
Since your campaign budget determines your advertisement’s frequency, you should increase it to improve this metric. Alternatively, you can increase the number of impressions by raising your bid or enhancing the quality of your ad.
Your campaign’s ads don’t appear if the Impressions column shows 0 (zero). Click here to discover the problems and fixing methods.
>> Read more: Why Google Ads Approved but No Impressions? How to Fix?
5. Clicks
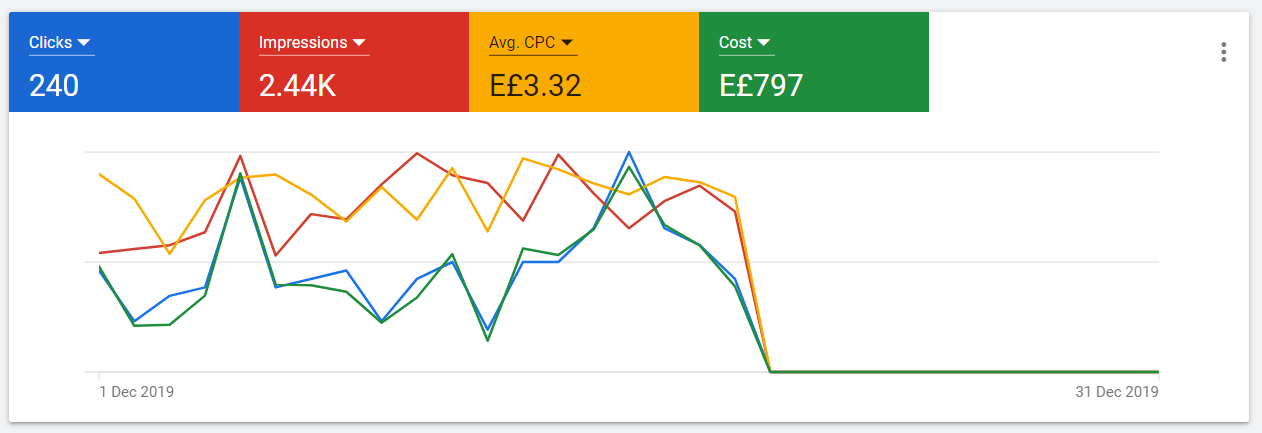
In Google Ads, “clicks” are tracked each time a user clicks on any blue, connected text in your advertisement.
It’s important to remember that even if a user clicks your advertisement but is unsuccessful in accessing your website (404 error, wifi problems, etc.), their interaction will still be recorded as a click.
In general, you shouldn’t make any decisions on this metric alone, as the number of clicks out of context doesn’t show the effectiveness of your ad. The number of clicks is used in a different metric, namely the click-through rate, which we will examine later.
6. Conversions
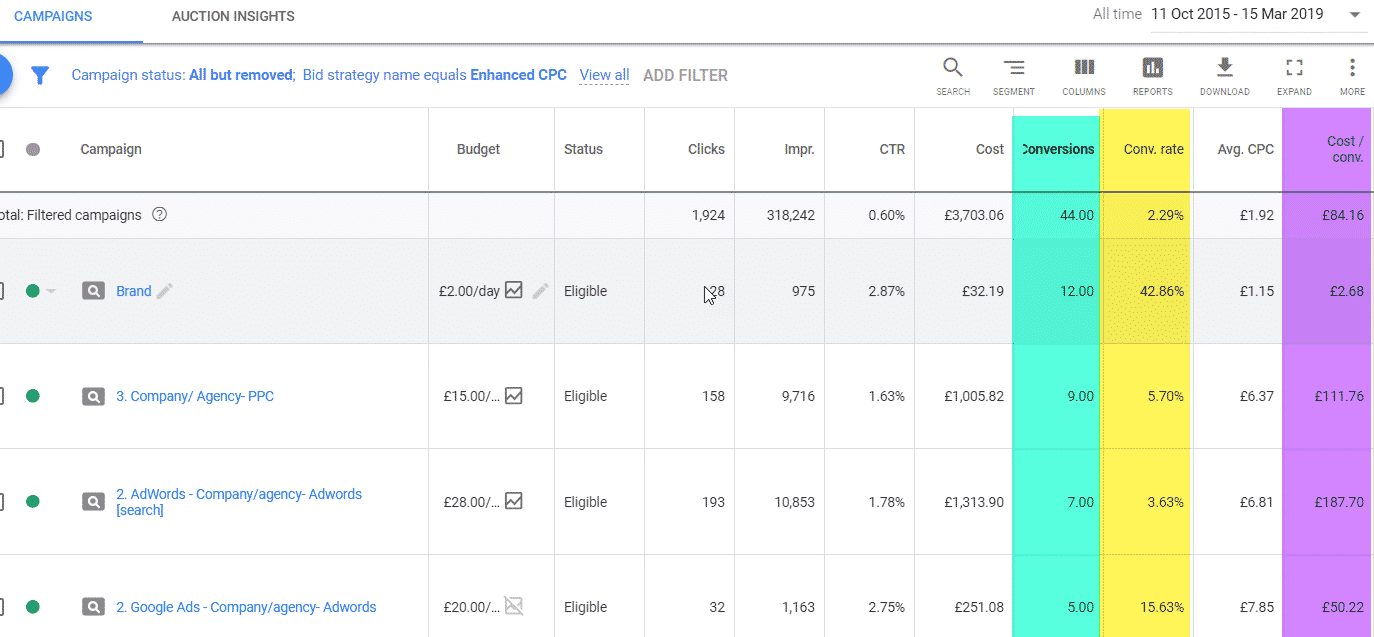
Conversions in Google Ads occur when people click your ad and complete a crucial activity. While ROAS and Cost per Conversion are crucial indicators, considering the overall number of conversions provides a complete picture.
If you use GA4 for conversion tracking, link it to Google Ads and create conversion actions from the relevant key events. Set important actions as primary conversions so Smart Bidding can optimize toward them.
7. Conversion Rate (CR)
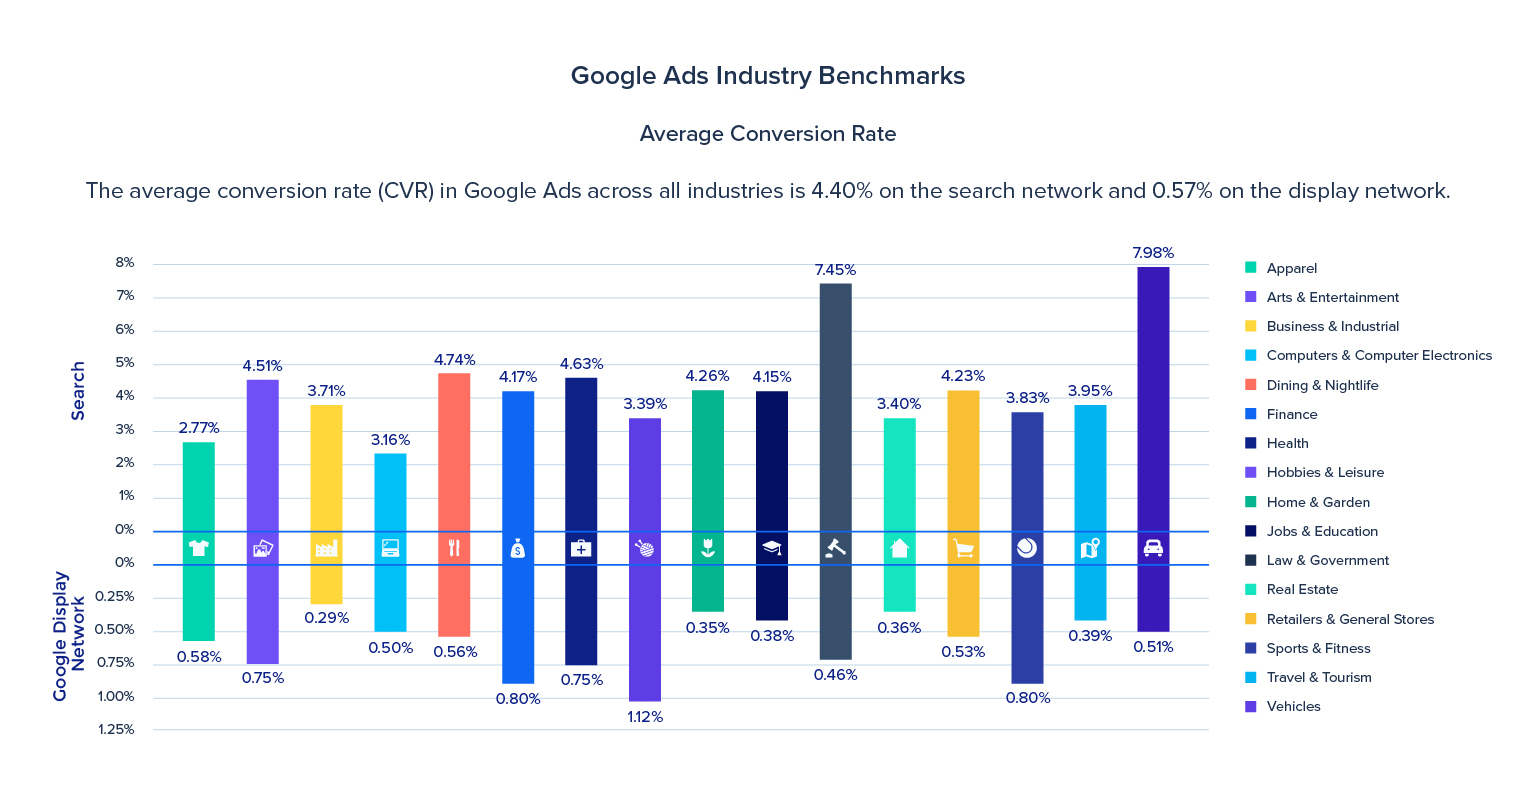
The ratio of clicks to conversions is known as the conversion rate. This indicator is one of the most crucial ones for your company, so you must monitor it constantly. A poor conversion rate might be difficult when you spend per click.
A fair ROAS may be challenging if your conversion rate is low (between 1% and 5%), as we’ll pay too much for each transaction.
In Google Analytics, compare the conversion rate from Google Ads with other channels. The conversion rate should be reasonable as Google Ads traffic consists of potential buyers. If the conversion rate needs improvement, take steps to optimize it.
- Specific keywords: Focus on specific keywords rather than general keywords. This will provide you with a better conversion rate.
- Negative keywords: Using negative keywords to prevent your ad from showing up when people search for particular keywords.
- Search terms report: You can see the exact words your customers searched for, then decide to exclude or add those keywords.
8. Click-Through Rate (CTR)
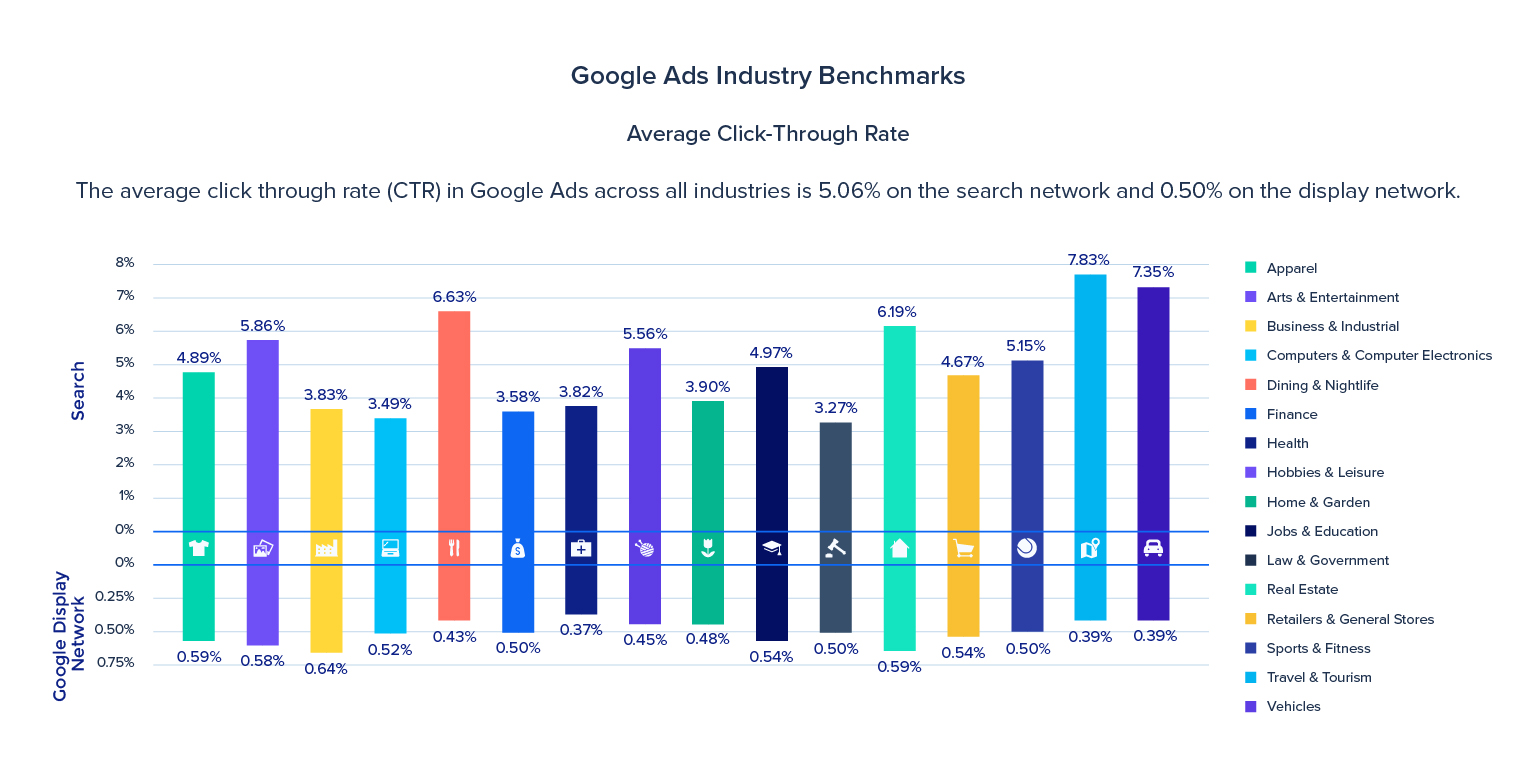
CTR in Google Ads is the overall ratio of how frequently individuals who view your ad actually click on it. It is computed by dividing the overall click-through rate for your ad by the overall impression rate.
This Google Ads metric measures the potency and applicability of your advertisement. The click-through rate reveals how frequently people click on your advertisement.
You divide the number of clicks by the number of impressions to determine the CTR of an advertisement. Since we’re discussing a rate, you must multiply that amount by 100.
Here is the equation: Click-through rate = Number of clicks/Number of impressions*100
So what constitutes a favorable click-through rate? According to reports, the average CTR across all industries is 5%.
Can you take any steps to improve your Google Ads’ CTR? There is, indeed!
Writing better ad wording is one of the best methods to raise the CTR of any of your ads. Some of the best practices for Google Ads copywriting include employing emotional triggers, concentrating on local audiences, and seeming natural.
9. Total Conversion Value (Revenue)
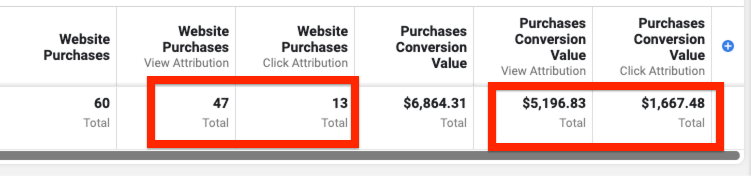
Monitor the overall conversion value, as it can fluctuate even with unchanged conversion numbers. Online stores should consider average order value to allow the conversion value to increase without sales growth. Understanding the entire conversion value is crucial for budget planning.
However, a small company’s healthy profit margin often falls between 7% and 10%. But keep in mind that other industries, like retail or the food industry, can have reduced margins. They frequently have more enormous overhead expenditures, which explains this.
Here are the tips to increase your revenue:
- Friendly user experience website: Make your site different from sites with similar services by providing a better experience.
- Carry out A/B test: You may enhance your earnings by conducting experiments to help you decide how to set up your ad settings.
- Use Google Analytics: Understand your site visitors better and set the right strategy with this powerful tool.
10. Quality Score
Certain advertisers might overlook this metric, which is unfortunate. Working with your Quality Score allows you to dramatically cut costs, which is vital for a successful organization.
This measure is crucial since it affects both your ad position in the Google Ads auction and your cost-per-click (CPC).
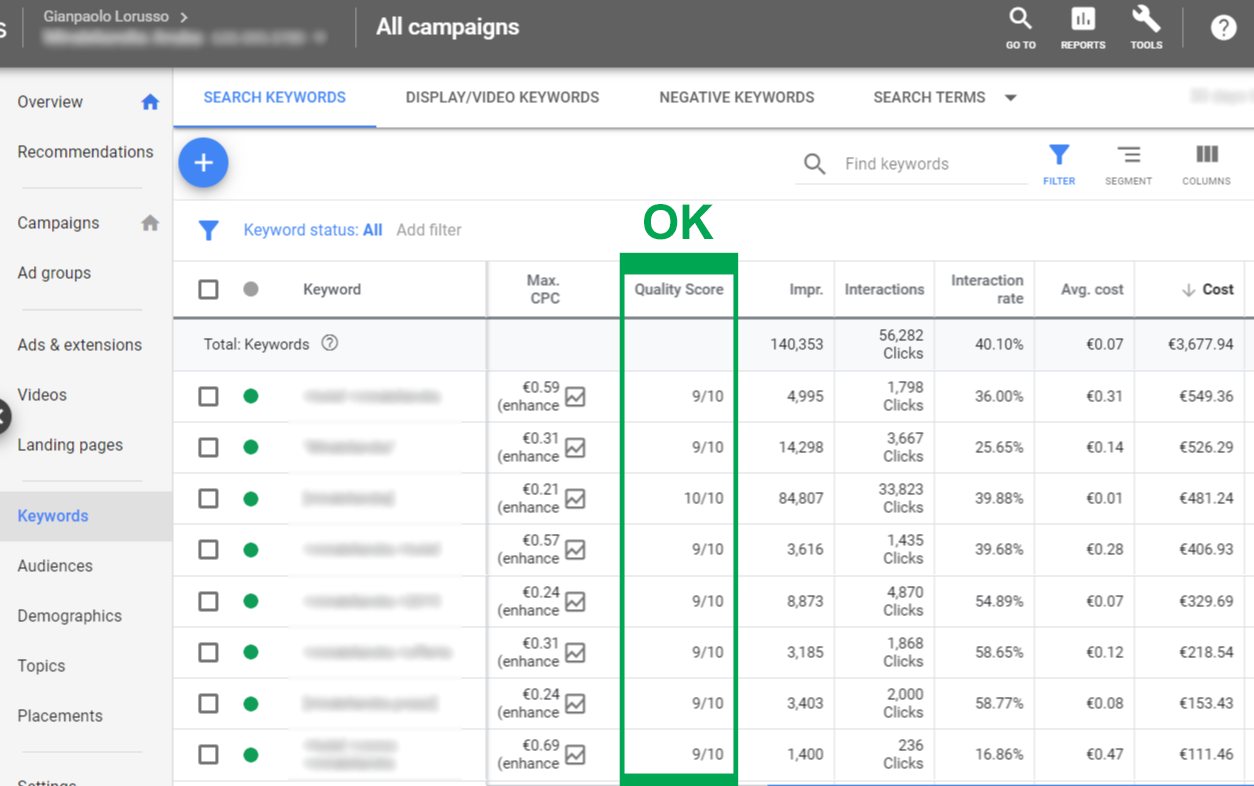
A better ad position and lower CPC result from having a high Quality Score, which indicates that your keywords and advertising are pertinent to your target audience. A lower ad position and a higher CPC are the effects of a low Quality Score.
Common Pitfalls When Analyzing Google Ads Metrics
Even experienced advertisers can misread campaign data, leading to wasted budget and poor optimization decisions.
- Focusing only on CPC: A high CPC is not always bad. Compare it with CPA, conversion value, and ROAS before making changes.
- Judging performance too early: Do not pause ads after only a few clicks. Wait for enough data and account for conversion delays.
- Blaming the landing page immediately: Low conversion rates may also come from poor search intent, weak offers, or tracking errors. Review the full funnel first.
- Using inaccurate conversion tracking: Incorrect data can mislead Smart Bidding. Check conversion actions, values, and primary goals regularly.
- Ignoring conversion lag: Recent CPA and ROAS may look worse before delayed conversions appear. Evaluate complete reporting periods.
- Relying on account-wide averages: Overall results can hide weak campaigns or segments. Break down data by keyword, device, location, and audience.
- Making changes too often: Frequent edits can disrupt automated bidding. Make one meaningful change at a time and allow performance to stabilize.
Mega Digital Case Study: TBP – TMJ Bagging & Packing
TBP – TMJ Bagging & Packing partnered with Mega Digital to improve Google Ads performance, generate at least 40 conversions per month, and use its $860 monthly budget more efficiently.
- Challenge: Broad targeting produced low conversion rates, while the company’s specialized B2B market and limited budget made it difficult to reach high-intent manufacturing customers without wasting spend.
- Solution: Mega Digital used specific Phrase Match keywords, added negative keywords, tested bidding strategies such as Maximize Conversions and Enhanced CPC, and scheduled ads from 8 AM to 10 PM.
- Results: The campaign achieved a 9.8x ROAS, a $19.88 CPA, and a $35.37 CPM.
FAQs about Google Ads Metrics
Check new campaigns daily for tracking, approval, or budget issues. Once performance stabilizes, review them once or twice a week and avoid making frequent changes before enough conversion data is available.
Conversion value and ROAS are key revenue metrics. Review them alongside CPA, profit margins, and average order value to understand actual profitability.
Check whether your keywords, ads, and landing pages match the customer’s intent. Also review your offer, mobile experience, checkout process, and conversion tracking for possible issues.
GA4 uses an event-based measurement model and can create Google Ads conversions from key events. When eligible, modeling can also estimate some missing data, but accurate setup and conversion selection are still essential for effective bidding.
Final words
Understanding Google Ads metrics is essential for running successful campaigns. Make sure your landing pages align with your ads, clearly communicate your unique selling proposition, and keep testing to identify what drives the best results.
As your trusted digital advertising partner, Mega Digital can help you analyze campaign data, optimize performance, and turn your Google Ads investment into sustainable business growth.