

As we approach the end of 2026, it’s crucial to assess whether your campaigns have reached their maximum potential. When investing in advertising, confidence in your campaigns’ performance is essential for business viability. Without delay, I present to you the all of Google Ads benchmarks in 2026!
Quick summary:
- The average cost per click across all industries currently stands at $5.42 for Search campaigns in 2026.
- Advertisers are observing an overall click-through rate of 6.64% based on recent global data.
- The typical conversion rate for Google Ads has settled at 8.18% following recent market shifts.
- Global inflation and high competition have driven the average cost per lead up to $66.69.
- Sectors like Career and Employment faced the steepest cost increases while Auto Sales saw notable cost reductions year over year.
Where did these Google Ads benchmarks 2026 come from?
With over 7 years of hands-on expertise as a Google Ads expert at Mega Digital (recognized as a top Google Premier Partner in APAC), I regularly receive exclusive data, such as heatmaps and benchmarks, directly from Google.
Apart from the data received directly from Google, I also gathered data from thousands of Mega Digital customers’ Search advertising campaigns conducted between January and October 2026.
The Google Ads benchmarks report includes the most important metrics such as average cost per click, average conversion rate, average click-through rate and cost per lead, along with year-over-year changes.
Google Ads benchmarks highlight in 2026
Using search ads is a well-known and powerful method to advertise your business online. When properly managed, pay-per-click (PPC) ads typically generate $2 in return for every $1 spent, giving an average return on investment (ROI) of 200%.
Overall cost by performance metrics
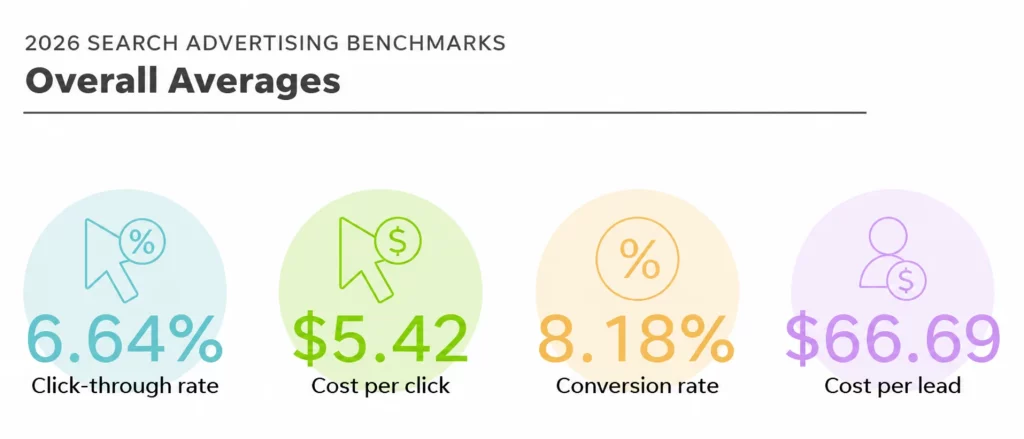
When considering all the data together, here are the typical US-based averages for Google Ads and Microsoft Ads, sourced directly from WordStream’s comprehensive 2026 data:
- The average click-through rate: 6.64%.
- The average cost per click: $5.42.
- The average conversion rate: 8.18%.
- The average cost per lead: $66.69.
YoY changes
To better understand the overall typical numbers mentioned earlier, it’s crucial to look at the year-over-year (YoY) trends. According to the same industry performance analysis by WordStream, here are the key shifts:
- Cost per lead (CPL) fell overall, showing an average decrease of nearly 5% year-over-year. This decrease comes despite global inflation and economic instability metrics reported by the IMF, which continue to affect prices in the digital advertising space.
- Conversion rates rose notably across 87% of industries, with the overall average increasing by nearly 9%.
- Cost per click (CPC) saw a slight uptick, rising around 3% overall.
- Click-through rates (CTR) remained nearly unchanged, with the overall average decreasing by around 0.3% year-over-year.
Most impacted industries
Based on the report’s sector-by-sector breakdown, some industries experienced notable increases in cost per lead.
For example, Automotive – For Sale had a 13.90% increase, Health & Fitness went up by 7.26%, and Career & Employment rose by 7.26%. But Travel cost 39.35% less for each potential customer, and Beauty & Personal Care decreased by 34.95%.
Google Ads benchmarks 2026 by Industry
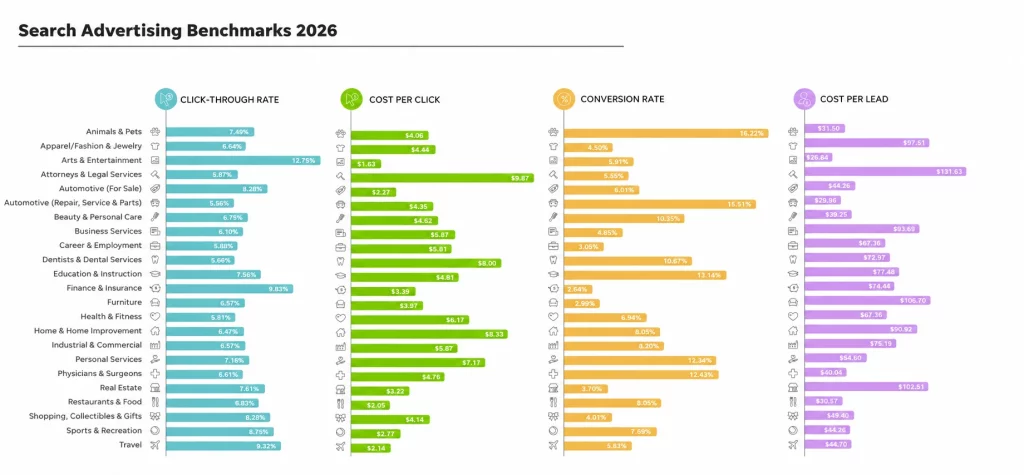
Based on WordStream’s latest 2026 search advertising benchmarks, the table below compares the average CPC, conversion rate, CTR, and CPL across 23 industries.
| Business category | Avg. CPC | Avg. CVR | Avg. CTR | Avg. CPL |
| Arts & Entertainment | $1.63 | 5.91% | 12.75% | $26.84 |
| Animals & Pets | $4.06 | 16.22% | 7.49% | $31.50 |
| Apparel/Fashion & Jewelry | $4.44 | 4.50% | 6.64% | $97.51 |
| Attorneys & Legal Services | $9.87 | 5.55% | 5.87% | $131.63 |
| Automotive – For Sale | $2.27 | 6.01% | 8.28% | $44.26 |
| Automotive – Repair, Service & Parts | $4.35 | 15.51% | 5.56% | $29.96 |
| Beauty & Personal Care | $4.62 | 10.35% | 6.75% | $39.25 |
| Business Services | $5.87 | 4.85% | 6.10% | $93.69 |
| Career & Employment | $5.81 | 3.05% | 5.88% | $67.36 |
| Dentists & Dental Services | $8.00 | 10.67% | 5.66% | $72.97 |
| Education & Instruction | $4.81 | 13.14% | 7.56% | $77.48 |
| Finance & Insurance | $3.39 | 2.64% | 9.83% | $74.44 |
| Furniture | $3.97 | 2.99% | 6.57% | $106.70 |
| Health & Fitness | $6.17 | 6.94% | 5.81% | $67.36 |
| Home & Home Improvement | $8.33 | 8.05% | 6.47% | $90.92 |
| Industrial & Commercial | $5.87 | 8.20% | 6.57% | $75.19 |
| Personal Services | $7.17 | 12.34% | 7.16% | $54.60 |
| Physicians & Surgeons | $4.76 | 12.43% | 6.61% | $40.04 |
| Real Estate | $3.22 | 3.70% | 7.61% | $102.51 |
| Restaurants & Food | $2.05 | 8.05% | 6.83% | $30.57 |
| Shopping, Collectibles & Gifts | $4.14 | 4.01% | 8.28% | $49.40 |
| Sports & Recreation | $2.77 | 7.69% | 8.75% | $44.26 |
| Travel | $2.14 | 5.83% | 9.32% | $44.70 |
| Overall average | $5.42 | 8.18% | 6.64% | $66.69 |
Cost per click trends
Attorneys and Legal Services recorded the highest average CPC at $9.87, followed by Home and Home Improvement at $8.33 and Dentists and Dental Services at $8.00.
Arts and Entertainment had the lowest CPC at $1.63, followed by Restaurants and Food at $2.05 and Travel at $2.14.
Year over year, CPC increased most in Real Estate at 27.27%, followed by Personal Services and Health and Fitness at 23.41%. Education and Instruction recorded the largest decrease at 22.79%.
Conversion rate trends
Animals and Pets achieved the highest conversion rate at 16.22%, followed by Automotive Repair, Service and Parts at 15.51% and Education and Instruction at 13.14%.
Finance and Insurance recorded the lowest conversion rate at 2.64%, followed by Furniture at 2.99% and Career and Employment at 3.05%.
Beauty and Personal Care saw the largest YoY increase at 32.34%, while Career and Employment recorded the largest decline at 29.42%.
Click-through rate trends
Arts and Entertainment achieved the highest CTR at 12.75%, followed by Finance and Insurance at 9.83% and Travel at 9.32%.
Automotive Repair, Service and Parts recorded the lowest CTR at 5.56%, followed by Dentists and Dental Services at 5.66% and Health and Fitness at 5.81%.
Education and Instruction recorded the strongest YoY increase at 31.71%, while Health and Fitness saw the largest decline at 19.08%.
Cost per lead trends
Attorneys and Legal Services had the highest CPL at $131.63, followed by Furniture at $106.70 and Real Estate at $102.51.
Arts and Entertainment recorded the lowest CPL at $26.84, followed by Automotive Repair, Service and Parts at $29.96 and Restaurants and Food at $30.57.
Automotive – For Sale experienced the largest YoY CPL increase at 13.90%, while Travel recorded the largest decrease at 39.35%.
Self-assessing campaign performance through benchmark data can be challenging for advertisers with limited Google Ads experience. If you have difficulty interpreting your data or determining the right campaign direction, consider seeking support from experienced Google Ads specialists at a trusted agency such as Mega Digital.
What we have learn from these Google Ads Benchmarks?
Having reviewed the Google Ads industry benchmarks, you might now be curious about ways to improve them. Now, let’s delve into the guidelines for effectively optimizing a campaign in 2026:
Ways to improve CTR in 2026
Don’t stress if your click-through rates are under the industry norm—there are quick ways to improve. Adjusting your ad content and targeting can have a big impact. Try new approaches, like using powerful language or emotional phrases in your ads to engage your audience and prompt clicks.
You might also need to reevaluate your target audience. Review your PPC keywords considering user intent. Your Search Terms Report could show if your ads cater more to users seeking information rather than those prepared to click and take action.
Ways to improve CPC in 2026
Lowering your cost per click means finding effective strategies while keeping a balanced approach. Don’t sacrifice quality clicks for cheaper CPC.
Start by checking your Quality Score. Great landing pages and relevant ads can earn you more cost-effective clicks if they meet user needs.
Also, reconsider your bidding strategy. Different approaches affect click costs based on your goals. Look into detailed breakdowns of Google Ads bidding strategies for more insights.
Ways to improve CVR in 2026
If your conversion rates lag behind your industry’s average, there might be multiple reasons. Assuming your other PPC metrics are on par, low clicks can contribute to this issue.
Start by optimizing your landing pages for mobile and accessibility, ensuring clear calls to action. Then, review keywords, ad content, and audience alignment in your Google Ads strategy for potential mismatches between offerings and audience intent.
FAQs about Google Ads benchmarks
A good CTR varies by industry and campaign type, but the 2026 average is 6.64%. Performance above your industry benchmark generally indicates strong ad relevance and engagement.
A high CPL may result from rising competition, higher CPCs, weak targeting, or low landing page conversion rates. Review the full conversion journey rather than focusing on ad costs alone.
Improve your Quality Score by aligning keywords, ad copy, and landing pages with search intent. You can also add negative keywords and refine targeting to reduce irrelevant clicks.
Use recent reports from established advertising sources such as WordStream. Compare these benchmarks with your own industry, location, campaign type, and business goals.
Wrap up
I trust this data report proves beneficial for your business effort.
Although these Google Ads benchmarks can provide a useful starting point for refining your strategy, it’s important to understand that there’s no definitive right or wrong way to advertise your business on platforms like Google. Each advertiser’s account is distinct and will differ from others.