

Achieving a competitive CPI Mobile Game rate is critical in 2026, where the focus has shifted from simple user acquisition to maximizing Return on Ad Spend (ROAS). To succeed, developers must understand current market standards and know some tips. In this blog post, we will provide a comprehensive guide to global CPI benchmarks and share expert strategies to lower your costs while boosting user quality.
Quick Summary
- In 2026, the focus has moved from securing the lowest CPI to balancing cost with Lifetime Value (LTV) to maximize Return on Ad Spend (ROAS).
- iOS CPI ($2.00–$5.00+) remains significantly higher than Android ($0.30–$1.50). Hardcore games command the highest entry costs, while Hypercasual remains the volume leader.
- With SKAdNetwork 5.0 and Privacy Sandbox, marketers must transition from deterministic tracking to probabilistic modeling and creative-led targeting.
- The most effective ways to lower CPI include leveraging AI for ad creatives, syncing ASO with paid campaigns, and utilizing broad algorithmic targeting.
What is CPI Mobile Game?
CPI Mobile Game (Cost Per Install) is a performance-based pricing model in cpi user acquisition where advertisers pay a specific fee only when a user successfully installs and opens their game application.

Unlike visibility-focused metrics like CPM (Cost Per Mille), CPI Mobile Game is purely result-oriented. It serves as the financial baseline for growth, allowing developers to measure the immediate efficiency of their ad spend across different networks and regions. Essentially, it provides a clear picture of the cost per install mobile games generate when entering your ecosystem.
In 2026, CPI Mobile Game is not just a cost. It’s a filter. The goal isn’t just to buy users cheaply, but to buy the right users at a price that allows your LTV to breathe.
How is CPI Calculated?
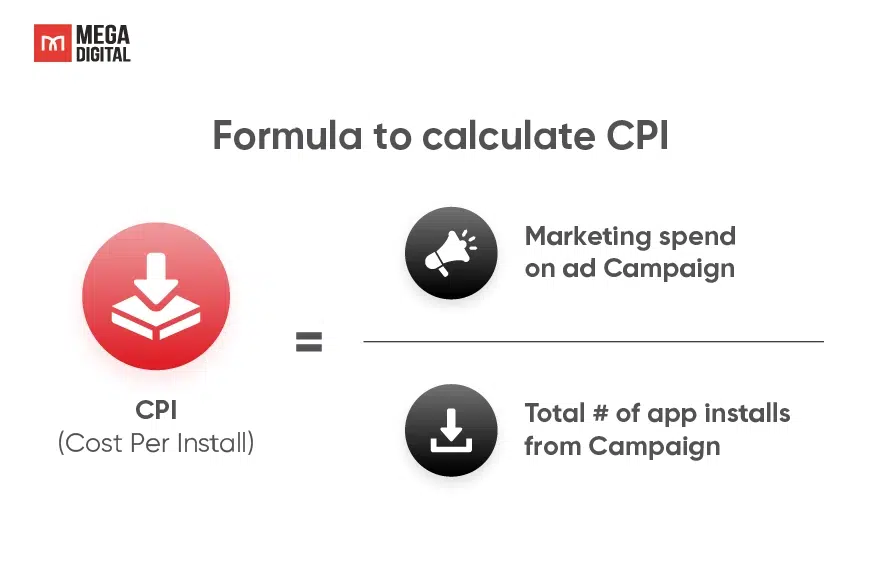
Calculating CPI Mobile Game requires dividing the total ad spend of a specific campaign by the total number of new installs generated during that same period.
CPI = Total Ad Spend ÷ Number of Installs
Specifically:
- Total Ad Spend: Encompasses the budget consumed across various networks (like TikTok, Google Ads, AppLovin).
- Total Installs: Must be verified installs, excluding fraud or duplicate downloads.
For example, if Mega Digital runs a campaign for a client spending $5,000 which results in 5,000 verified installs, the CPI Mobile Game cost is $1.00. However, in 2026, developers often calculate “Effective CPI” (eCPI), which factors in organic uplift, the natural installs that occur as a result of the paid campaign’s visibility.
Importance of CPI Mobile Games for Developers and Marketers
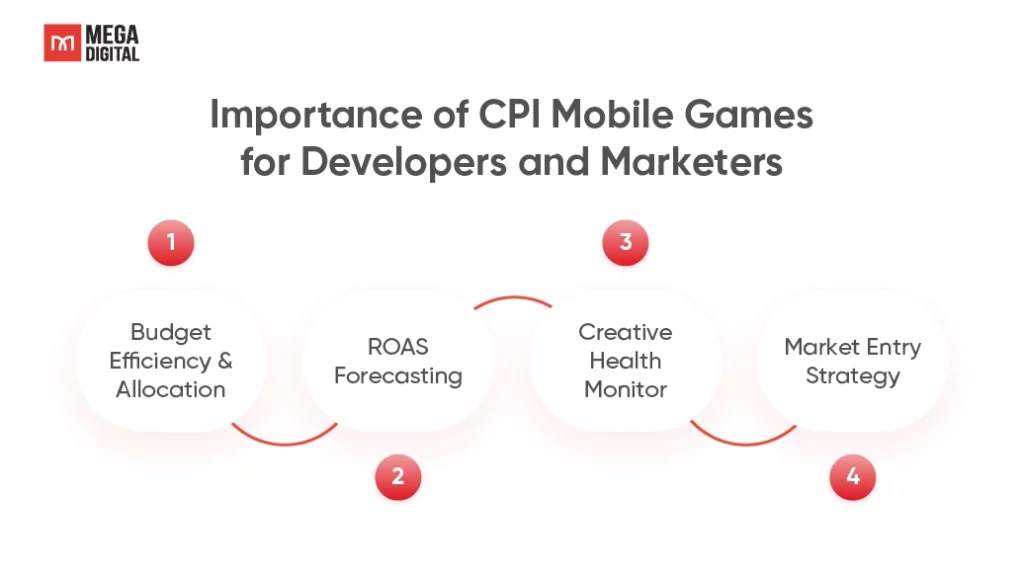
CPI Mobile Games is more than a line item on a spreadsheet; it is the pulse of your game’s financial health. Here are several importance of CPI Mobile Games for Developers and Marketers.
- Budget Efficiency & Allocation: It serves as the primary compass for budget distribution. Agencies like Mega Digital use CPI data to identify which channels (e.g., TikTok vs. Facebook) yield the lowest cost, reallocating funds to maximize install volume without increasing total spend.
- ROAS Forecasting: CPI is the denominator in the profitability equation. Knowing your exact acquisition cost allows you to calculate how much Lifetime Value (LTV) a user must generate to break even, making it the foundation of all ROAS modeling.
- Creative Health Monitor: A sudden spike in CPI is often the first warning sign of “ad fatigue.” It signals to developers that their current creatives are losing relevance and that it’s time to refresh visuals or test new concepts before performance degrades further.
- Market Entry Strategy: For developers planning global expansion, CPI benchmarks help determine feasibility. Understanding that Tier 1 markets cost 5x more than Tier 3 markets helps studios decide whether to pursue a “high-value” strategy in the US or a “volume-based” strategy in SEA.
Key Drivers of Mobile Game CPI
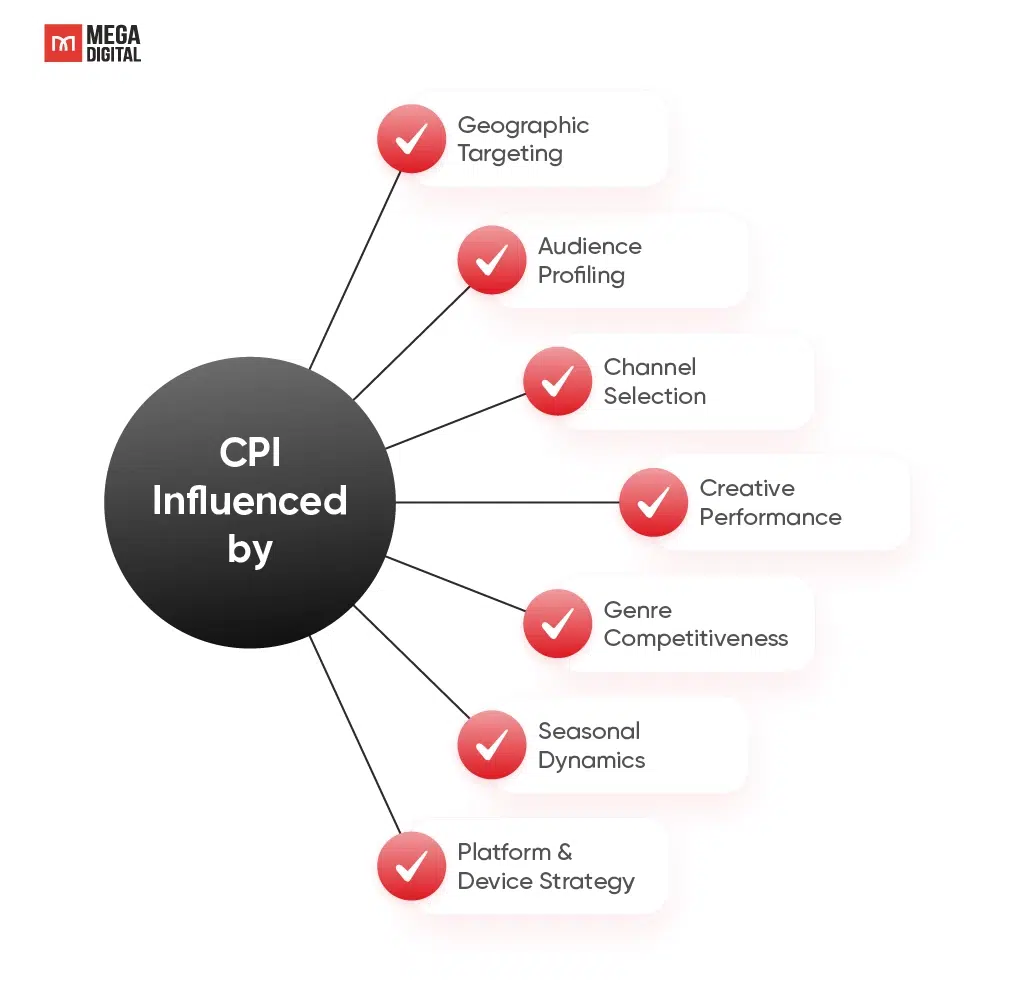
Detail information about key drivers of mobile game install cost that you should follow below:
- Audience Profiling: Targeting highly sought-after segments or ultra-niche demographics often leads to inflated bidding prices due to intense competition.
- Channel Selection: Each platform (Social, Search, Ad Networks) has a distinct pricing structure dictated by its reach and advertiser density.
- Creative Performance: High-quality ads that boost Click-Through Rates (CTR) directly signal relevance to algorithms, effectively lowering your final CPI. At Mega Digital, we consistently find that AI-optimized creatives can lower CPI by up to 30%.
- Genre Competitiveness: High-monetization categories (like RPGs) face intense bidding wars, naturally driving up costs compared to less saturated genres.
- Seasonal Dynamics: CPI spikes significantly during peak periods like Holidays or Black Friday due to surged advertiser demand.
- Platform & Device Strategy: Developing for iOS typically costs more than Android due to higher user LTV; tablet targeting also varies from mobile.
- Geographic Targeting: Tier 1 markets command premium prices, whereas emerging regions offer lower entry costs but require volume-based strategies.
Global CPI Mobile Game Benchmarks in 2026
Analyzing CPI benchmarks mobile games is divided into 3 main categories base on platform ecosystems, game genre mechanics, and regional economic tiers.
Note: The data below represents projected averages for 2026 based on market trends from late 2025. Actual costs may vary based on campaign optimization.
CPI Rates Comparison: iOS vs. Android
According to Business of App, iOS generally commands a significantly higher CPI compared to Android, driven by the superior purchasing power of Apple users and the higher difficulty of targeting due to privacy restrictions.
- iOS: Average CPI Mobile Game rates range from $2.00 to $5.00+. The cost is elevated because Apple’s ecosystem is saturated with high-LTV users who are more likely to make In-App Purchases (IAP).
- Android: Average CPI hovers between $0.30 and $1.50. Android offers massive scale and volume. While the cost is significantly lower, the challenge lies in device fragmentation and filtering for quality users.
However, for developers targeting the Asian market (specifically SEA), Android remains the dominant volume driver, often allowing for aggressive scaling at sub-$0.50 CPIs.
Average CPI Costs by Game Genre
According to the latest benchmarks from Liftoff’s 2025 Report, there are distinct pricing tiers across game genres. Hardcore games command the highest costs due to fierce competition for whales, while Hypercasual games maintain the lowest entry barriers.
Below is the table of average CPI costs by Game Genre:
Game Gener | Avg. CPI (iOS) | Avg.CPI (Android) |
RPG & Hardcore | $5.00 – $9.00+ | $1.50 – $4.00 |
Casino & Slots | $6.00 – $11.00 | $3.00 – $6.00 |
Action (Shooter &MOBA) | $3.50 – $6.00 | $0.80 – $2.50 |
Simulation & Sports | $2.50 – $5.00 | $0.60 – $2.00 |
Casual $ Puzzle | $1.50 – $3.50 | $0.40 – $1.00 |
Hypercasual & Hybrid | $0.60 – $1.20 | $0.15 – $0.50 |
As the table illustrates, high-LTV genres like RPG & Strategy command significant entry costs. Developers, like partnering with Mega Digital, are often willing to pay this premium because capturing a single “whale” user in these categories can generate thousands of dollars in lifetime revenue, justifying the higher initial CPI.
CPI Rate Differences by Region
According to The AppsFlyer, Regional economic power creates a massive disparity in CPI Mobile Game trends, with Tier 1 markets costing up to 10 times more than Tier 3 regions.
Region Tier | Key Markets | Avg.CPI Range | Market Characteristics |
Tier 1 | North America, Japan, South Korea, UK | $3.50 – $6.00+ | High competition and demanding player base. High ARPU justifies the premium cost. |
|
Tier 2 |
Western Europe, Taiwan, Hong Kong |
$1.50 – $3.00 |
A balanced mix of user quality and install volume |
|
Tier 3 |
Southeast Asia, India, Brazil, LATAM |
$0.05 – $0.50 |
“Volume” markets. Strategy often focuses on Ad Monetization rather than IAP due to lower user spending. |
CPI Mobile Game Trends in the Privacy Era (2026)
The era of precise user tracking is over. With the maturation of SKAdNetwork 5.0 (iOS) and the full rollout of Privacy Sandbox (Android), the way we measure CPI has fundamentally changed.
- Probabilistic Attribution: Marketers can no longer rely on deterministic data (IDFA/GAID) for every install. Instead, agencies like Mega Digital employ advanced probabilistic modeling to estimate campaign performance and assign CPI values to specific creatives.
- Contextual Targeting Resurgence: Since behavioral data is scarce, contextual signals (e.g., placing a game ad within a similar game genre app) have become crucial for keeping CPI low.
- Creative-Led User Acquisition: In a privacy-first world, the creative is the targeting. Algorithms use the content of your ad to find relevant users. This makes cpi optimization mobile games heavily dependent on creative quality rather than manual audience settings.
Limitations of CPI in Mobile Marketing
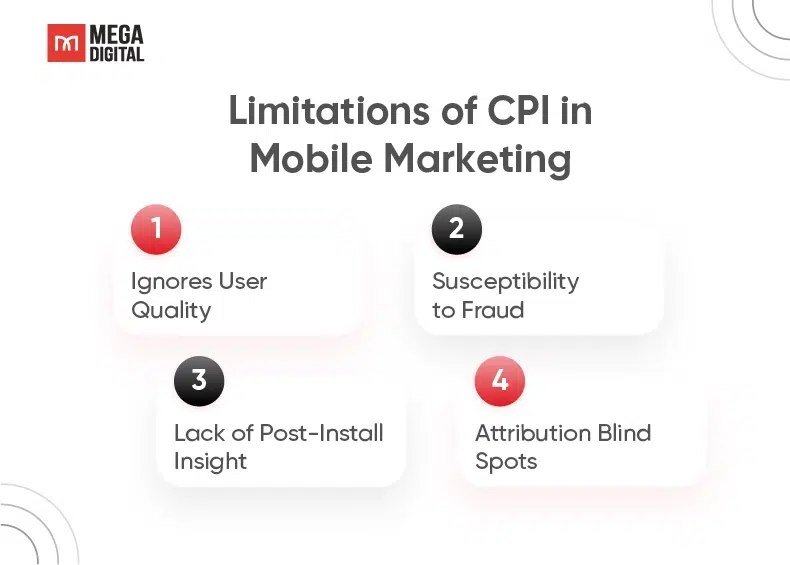
Here are some problem that developers and marketers faced. Detail information that you should follow below:
- Ignores User Quality: A campaign optimized solely for the lowest CPI often attracts low-intent users or “window shoppers” who churn immediately. A $0.20 install is worthless if the user never completes the tutorial.
- Susceptibility to Fraud: The CPI model is a prime target for install fraud, including bot farms and device emulators. Without robust anti-fraud tools, something Mega Digital integrates into all client campaigns, developers risk draining budgets on fake users.
- Lack of Post-Install Insight: CPI tells you the cost of entry but reveals nothing about engagement. It fails to account for Retention, ARPU (Average Revenue Per User), or LTV, which are the true drivers of sustainable growth.
- Attribution Blind Spots: With the strict privacy protocols of SKAdNetwork 4.0/5.0 and Privacy Sandbox, attributing a specific install to a specific dollar of ad spend has become less direct, making raw CPI data less granular than in the past.
4 Tips to Improve CPI Mobile Game Performance
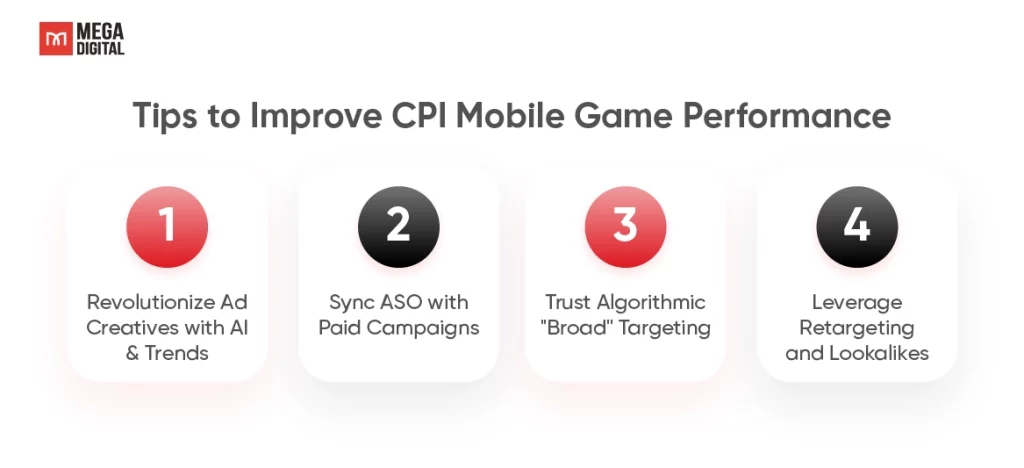
After discovering the limitations of CPI in Mobile Marketing, the next step is to improve CPI optimization mobile game. Here are 4 Mega Digital tips to optimize your campaigns:
- Revolutionize Ad Creatives with AI & Trends: Since ad creatives drive 70% of UA performance, replace static images with Playable Ads and UGC videos. Utilizing AI tools to rapidly iterate variations can significantly lower your tiktok ads cpi by boosting CTR and relevance.
- Sync ASO with Paid Campaigns: Treat your product page as your landing page by continuously A/B testing icons and screenshots, and using Custom Product Pages (CPP) to visually match your ad creative theme, preventing CVR drops and CPI spikes.
- Trust Algorithmic “Broad” Targeting: Instead of expensive hyper-targeting, allow modern algorithms (like Google App Campaigns or TikTok Pangle) to find high-intent users through broad targeting, leveraging machine learning to identify valuable players at a lower cost.
- Leverage Retargeting and Lookalikes: Maximize efficiency by creating “Lookalike Audiences” from your high-value user base and retargeting those who viewed ads but didn’t install, as re-engaging potential players is far more cost-effective than cold prospecting.
>>> Read more: How to Optimize CPI with ASO for IAP Mobile Games on TikTok Ads
What is the Relationship Between CPI, LTV, and ROAS?
CPI acts as the entry cost, LTV determines the long-term value of that user, and ROAS is the ultimate metric defining the profitability of the relationship.
Understanding this “Golden Triangle” is crucial for any developer wanting to survive in 2026. You cannot evaluate CPI Mobile Game metrics in isolation. A low CPI is meaningless if LTV is zero. Conversely, a high CPI is acceptable if the ROAS is positive.
The formula for profitability is:
ROAS = (LTV ÷ CPI) * 100%
- If ROAS > 100%: You are profitable. You can afford to bid higher (increase CPI) to scale up volume.
- If ROAS < 100%: You are losing money. You must either lower CPI (better creatives) or increase LTV (better game monetization).
For instance, in the TikTap Challenge campaign – XGame Studio, Mega Digital shifted the focus from minimizing CPI to maximizing user engagement. By targeting users likely to complete the “Music + Tap” gameplay loop, the initial CPI increased slightly, but the retention rate and LTV soared. This strategy proved that acquiring the right user is far more profitable than acquiring the cheapest one, ultimately driving a sustainable ROAS.
Don’t fear high CPI. Fear low LTV. If you pay $5 for a user who gives you $10, you win. If you pay $0.50 for a user who gives you $0, you lose.
FAQs about CPI Mobile Game
There is no single number. A “good” CPI Mobile Game rate is one that is lower than your LTV. However, generally speaking, anything below $0.50 for Hypercasual and below $3.00 for Midcore games in Tier 1 markets is considered efficient.
eCPM (effective Cost Per Mille) is the cost for 1,000 impressions. If your ad creative has a high Click-Through Rate (CTR) and Conversion Rate (CVR), the ad network can charge you a lower CPI while still making a high eCPM for themselves. Thus, better creatives = lower CPI.
No. CPI (Cost Per Install) pays for the installation. CPA (Cost Per Action) pays for a specific post-install event, such as completing a tutorial or making a purchase. CPA is generally higher than CPI but carries less risk for the advertiser.
>>> Read more: In-App Advertising (IAA) done right: The Complete Guide 2026
Conclusion
Benchmarking and lowering CPI Mobile Game costs in 2026 requires a strategic shift from simple cost-cutting to holistic value optimization, ensuring that competitive entry costs are balanced with robust LTV to maximize ROAS. Ready to scale your game? Contact Mega Digital today to transform your user acquisition strategy and achieve sustainable growth.