

How do you know whether your Facebook ad campaigns perform well or not? It’s kinda easy if you take a look through the Facebook Ads Benchmarks in 2025 below.
However, as an expert in Facebook Advertising, we – Mega Digital not only show you the metrics, but we also do some analysis and evaluate it for you, too. Just read this blog, and you’ll definitely know what to do for your business.
The Big Picture of Facebook Ads Benchmarks
In 2025, we definitely have plenty of platforms to advertise, like Google, TikTok, etc. However, Facebook, the platform with more than 3 billion active monthly active users, is still one of the platforms you cannot miss. The algorithm of this a platform is stable, and so is the solid advertising cost.
Although the benchmarks of Facebook Ads change year to year, updating these metrics will never be a waste if you still want to advertise on this platform. So, let’s take a look through what are the Facebook Ads Benchmarks in 2025.
Facebook Key Performance Metrics
There are many types of metrics when we talk about Facebook Ads. However, to evaluate the effectiveness of your campaigns, there are only 4 types of indicators that you must see first before viewing the others. Here are the 4 critical ones you will use to measure your campaigns.
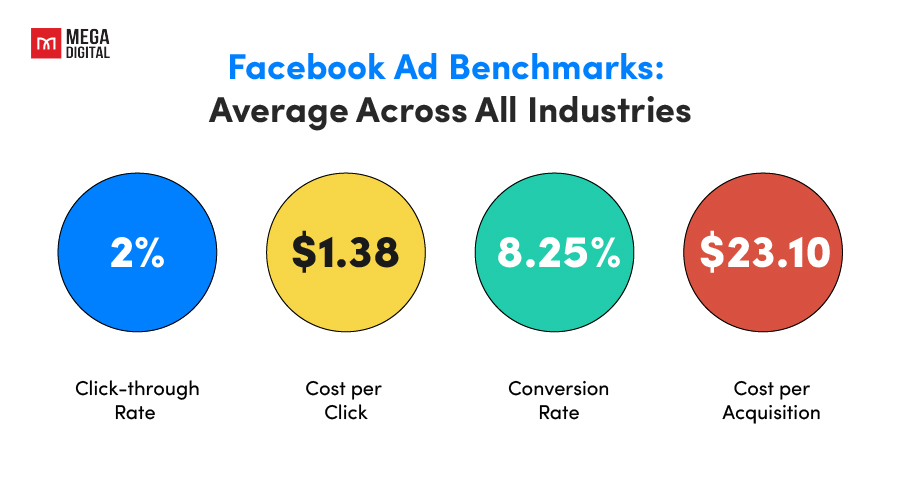
- The Average of Click-through rate: 2%
- The Average of Cost per click: $1.38
- The Average of Conversion rate: 8.25%
- The Average Cost per Acquisition: $23.10
Changes in Facebook Ads Benchmarks 2025 Compared to 2024
Only viewing the metrics above will definitely not help you understand if Facebook Ads in 2025 are better or worse than last year. However, just make a comparison to 2024, and you will see this upward trend.
| Facebook Ads Benchmarks | 2024 | 2025 | % changes |
|---|---|---|---|
| Average CTR | 0.9% | 2% | 122% |
| Average CPC | $1.72 | $1.38 | -19.8% |
| Average CVR | 9.21% | 8.25% | -10.4% |
| Average CPA | $5.84 | $23.10 | 295.5% |
Benchmark for Facebook Ads Across 19 Industries
In this part, we will explore the industry averages for each metric based on Facebook advertising objectives, and take a closer look at the benchmark across different industries in 2025.
Facebook provides 5 objectives for advertisers. However, based on their primary goals, we can divide Facebook ad objectives into 3 main groups: Traffic objectives, Lead objectives, and Sales objectives to keep tracking easily
- For Traffic goal, you should focus on measuring effectiveness based on two metrics: CTR and CPC. Since this campaign is aimed at driving traffic, cost per lead and conversion rate metrics are typically higher. I’ve excluded these metrics to focus on the ones that matter most for your objective.
- For Lead goal, you need to consider all four metrics: CTR, CPC, CVR, and CPA.
- For Sale goal (if you are an e-commerce business), you should take into consideration CTR, CPC, and ROAS metrics.
Average Facebook CTR
CTR in Facebook Ads represents the percentage of people who click on your ad after seeing it. Average CTR can vary significantly by industry.
#1 CTR metric in Facebook Traffic Campaigns
The average click-through rate (CTR) for Facebook ads in traffic campaigns across various industries is 1.51%.
Industries that achieved the highest click-through rates (CTRs) on their Facebook ads, optimized for traffic, included
- Arts & Entertainment at 2.55%
- Real Estate at 2.45%.
Conversely, sectors with the lowest CTRs were Finance & Insurance with a CTR of 0.88%, Automotive — Repair, Service & Parts at 0.99%, and Attorneys & Legal Services at 0.99%.
| Business Category | Avg. click-through rate |
| Animals & Pets | 1.63% |
| Apparel / Fashion & Jewelry | 1.13% |
| Arts & Entertainment | 2.55% |
| Attorneys & Legal Services | 0.99% |
| Automotive — For Sale | 1.18% |
| Automotive — Repair, Service, & Parts | 0.99% |
| Beauty & Personal Care | 1.34% |
| Business Services | 1.37% |
| Career & Employment | 1.31% |
| Dentists & Dental Services | 0.81% |
| Education & Instruction | 1.20% |
| Finance & Insurance | 0.88% |
| Furniture | 1.15% |
| Health & Fitness | 1.68% |
| Home & Home Improvement | 1.23% |
| Industrial & Commercial | 1.03% |
| Personal Services | 1.28% |
| Physicians & Surgeons | 1.02% |
| Real Estate | 2.45% |
| Restaurants & Food | 2.29% |
| Shopping, Collectibles, & Gifts | 1.82% |
| Sports & Recreation | 1.30% |
| Travel | 2.06% |
#2 CTR metric in Lead Gen Campaigns
The average click-through rate (CTR) for Facebook ads in lead gen campaigns across various industries is 2.50%.
Industries such as Travel, Real Estate, and Sports & Recreation achieved high click-through rates (CTRs) on their Facebook ads, at 6.62%, 3.69%, and 3.29%.
On the other hand, industries such as Automotive Repair, Health & Fitness, and Attorneys & Legal Services exhibited the lowest average conversion rates at 1.38%, 1.66%, 1.79%
| Business Category | Avg. click-through rate |
| Arts & Entertainment | 3.70% |
| Attorneys & Legal Services | 1.79% |
| Automotive — Repair, Service & Parts | 1.38% |
| Beauty & Personal Care | 2.46% |
| Business Services | 2.70% |
| Career & Employment | 2.37% |
| Dentists & Dental Services | 1.80% |
| Education & Instruction | 2.44% |
| Finance & Insurance | 1.98% |
| Furniture | 2.55% |
| Health & Fitness | 1.66% |
| Home & Home Improvement | 1.80% |
| Industrial & Commercial | 1.50% |
| Personal Services (Weddings, Cleaners, etc.) | 2.72% |
| Physicians & Surgeons | 3.17% |
| Real Estate | 3.69% |
| Restaurants & Food | 1.85% |
| Sports & Recreation | 3.29% |
| Travel | 6.62% |
#3 Compare CTR in Traffic Campaigns with Lead Gen Campaigns
Here’s a summary of the average CTR for both objectives:
| Facebook Ad Benchmarks | Traffic objective | Lead objective |
| Average CTR | 1.51% | 2.50% |
Why CTR of Lead Objectives is higher than Traffic Objectives:
Traffic campaigns often have broader targeting to reach a larger audience, which might include users with lower purchase intent.
Lead Generation campaigns can target users further down the funnel, leading to a more qualified audience with higher click propensity.
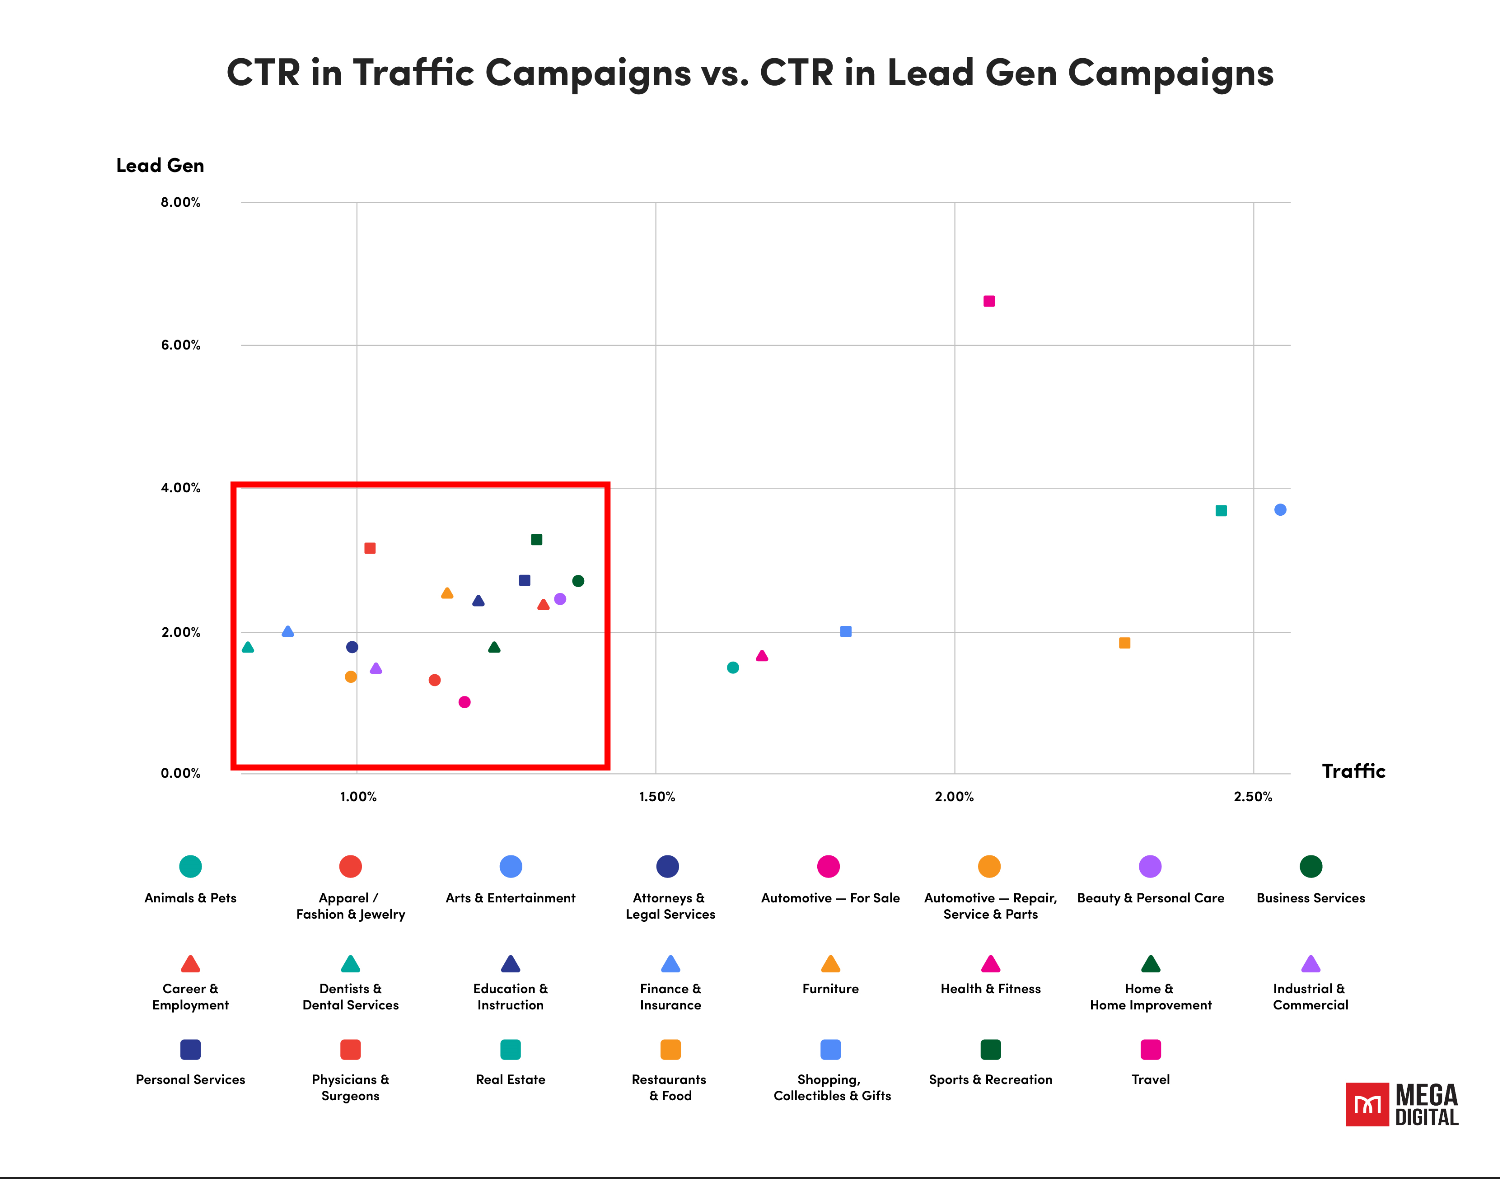
In the chart above, as you can see, the travel industry stands out from the rest. This is understandable, as post-COVID-19, there has been a marked increase in demand for travel services. At this time, both lead generation and traffic campaigns are viable options.
For other industries, such as Real Estate, Arts & Entertainment, Restaurant & Food, Shopping, Collectibles & Gifts, and Animals & Pets, running traffic ads is the preferred strategy. This is because these sectors are more focused on branding rather than direct customer acquisition. With most of their operations being offline, it’s crucial for them to establish a strong market presence. If you’re operating in these markets, it would be wise to consider this approach.
The remaining industries, identified in the red zone of the chart, are highly competitive. To outperform your rivals on Facebook Ads in these sectors, the focus must be on innovative ad creatives. Additionally, be prepared to allocate a substantial budget for these campaigns.
Average Facebook CPC
CPC (Cost Per Click) indicates how much you pay each time someone clicks on your ad.
#1 CPC metric in Facebook Traffic Campaigns
The average cost per click (CPC) for Facebook ads in traffic campaigns across various industries is $0.83.
Industries with the most affordable Cost Per Click (CPC) rates were:
- Travel at $0.43
- Arts & Entertainment at $0.44
- Restaurants & Food at $0.52
On the other hand, sectors experiencing higher CPCs for traffic objectives included:
- Dentists & Dental Services at $1.27
- Furniture at $1.19
- Attorneys & Legal Services at $1.15
| Business Category | Avg. cost per click |
| Animals & Pets | $0.76 |
| Apparel / Fashion & Jewelry | $1.11 |
| Arts & Entertainment | $0.44 |
| Attorneys & Legal Services | $1.15 |
| Automotive — For Sale | $0.70 |
| Automotive — Repair, Service, & Parts | $0.99 |
| Beauty & Personal Care | $0.88 |
| Business Services | $0.84 |
| Career & Employment | $0.70 |
| Dentists & Dental Services | $1.27 |
| Education & Instruction | $0.79 |
| Finance & Insurance | $1.11 |
| Furniture | $1.19 |
| Health & Fitness | $0.90 |
| Home & Home Improvement | $0.95 |
| Industrial & Commercial | $0.80 |
| Personal Services | $0.87 |
| Physicians & Surgeons | $1.08 |
| Real Estate | $0.65 |
| Restaurants & Food | $0.52 |
| Shopping, Collectibles, & Gifts | $0.65 |
| Sports & Recreation | $0.77 |
| Travel | $0.43 |
#2 CPC metric in Facebook Lead Gen Campaigns
The average cost per click (CPC) for Facebook ads in lead gen campaigns across various industries is $1.92.
Industries with the most affordable Cost Per Click (CPC) rates were:
- Arts & Entertainment at $0.87
- Travel at $0.96
- Sports & Recreation at $1.11
On the other hand, sectors experiencing higher CPCs for lead generation objectives included:
- Attorneys & Legal Services at $5.42
- Dentists & Dental Services at $3.82
- Physicians & Surgeons at $3.63
| Business Category | Avg. cost per click |
| Arts & Entertainment | $0.87 |
| Attorneys & Legal Services | $5.42 |
| Automotive — Repair, Service & Parts | $2.86 |
| Beauty & Personal Care | $2.16 |
| Business Services | $1.73 |
| Career & Employment | $1.34 |
| Dentists & Dental Services | $3.82 |
| Education & Instruction | $1.80 |
| Finance & Insurance | $2.94 |
| Furniture | $1.58 |
| Health & Fitness | $3.60 |
| Home & Home Improvement | $2.08 |
| Industrial & Commercial | $2.69 |
| Personal Services (Weddings, Cleaners, etc.) | $1.88 |
| Physicians & Surgeons | $3.63 |
| Real Estate | $1.22 |
| Restaurants & Food | $2.61 |
| Sports & Recreation | $1.11 |
| Travel | $0.96 |
#3 Compare CPC in Traffic Campaigns with Lead Gen Campaigns
Here’s a summary of the average CPC for both objectives:
| Facebook Ad Benchmarks | Traffic objective | Lead objective |
| Average CPC | $0.83 | $1.92 |
Why is the CPC of Traffic Objectives lower than Lead Objectives?
Facebook allows for broader targeting with Traffic objectives. This makes the pool of potential users much larger, leading to a lower cost per click.
In a while, lead gen campaigns require a higher-intent action – providing their contact information. This narrows the pool and increases competition for those clicks, driving the CPC up.
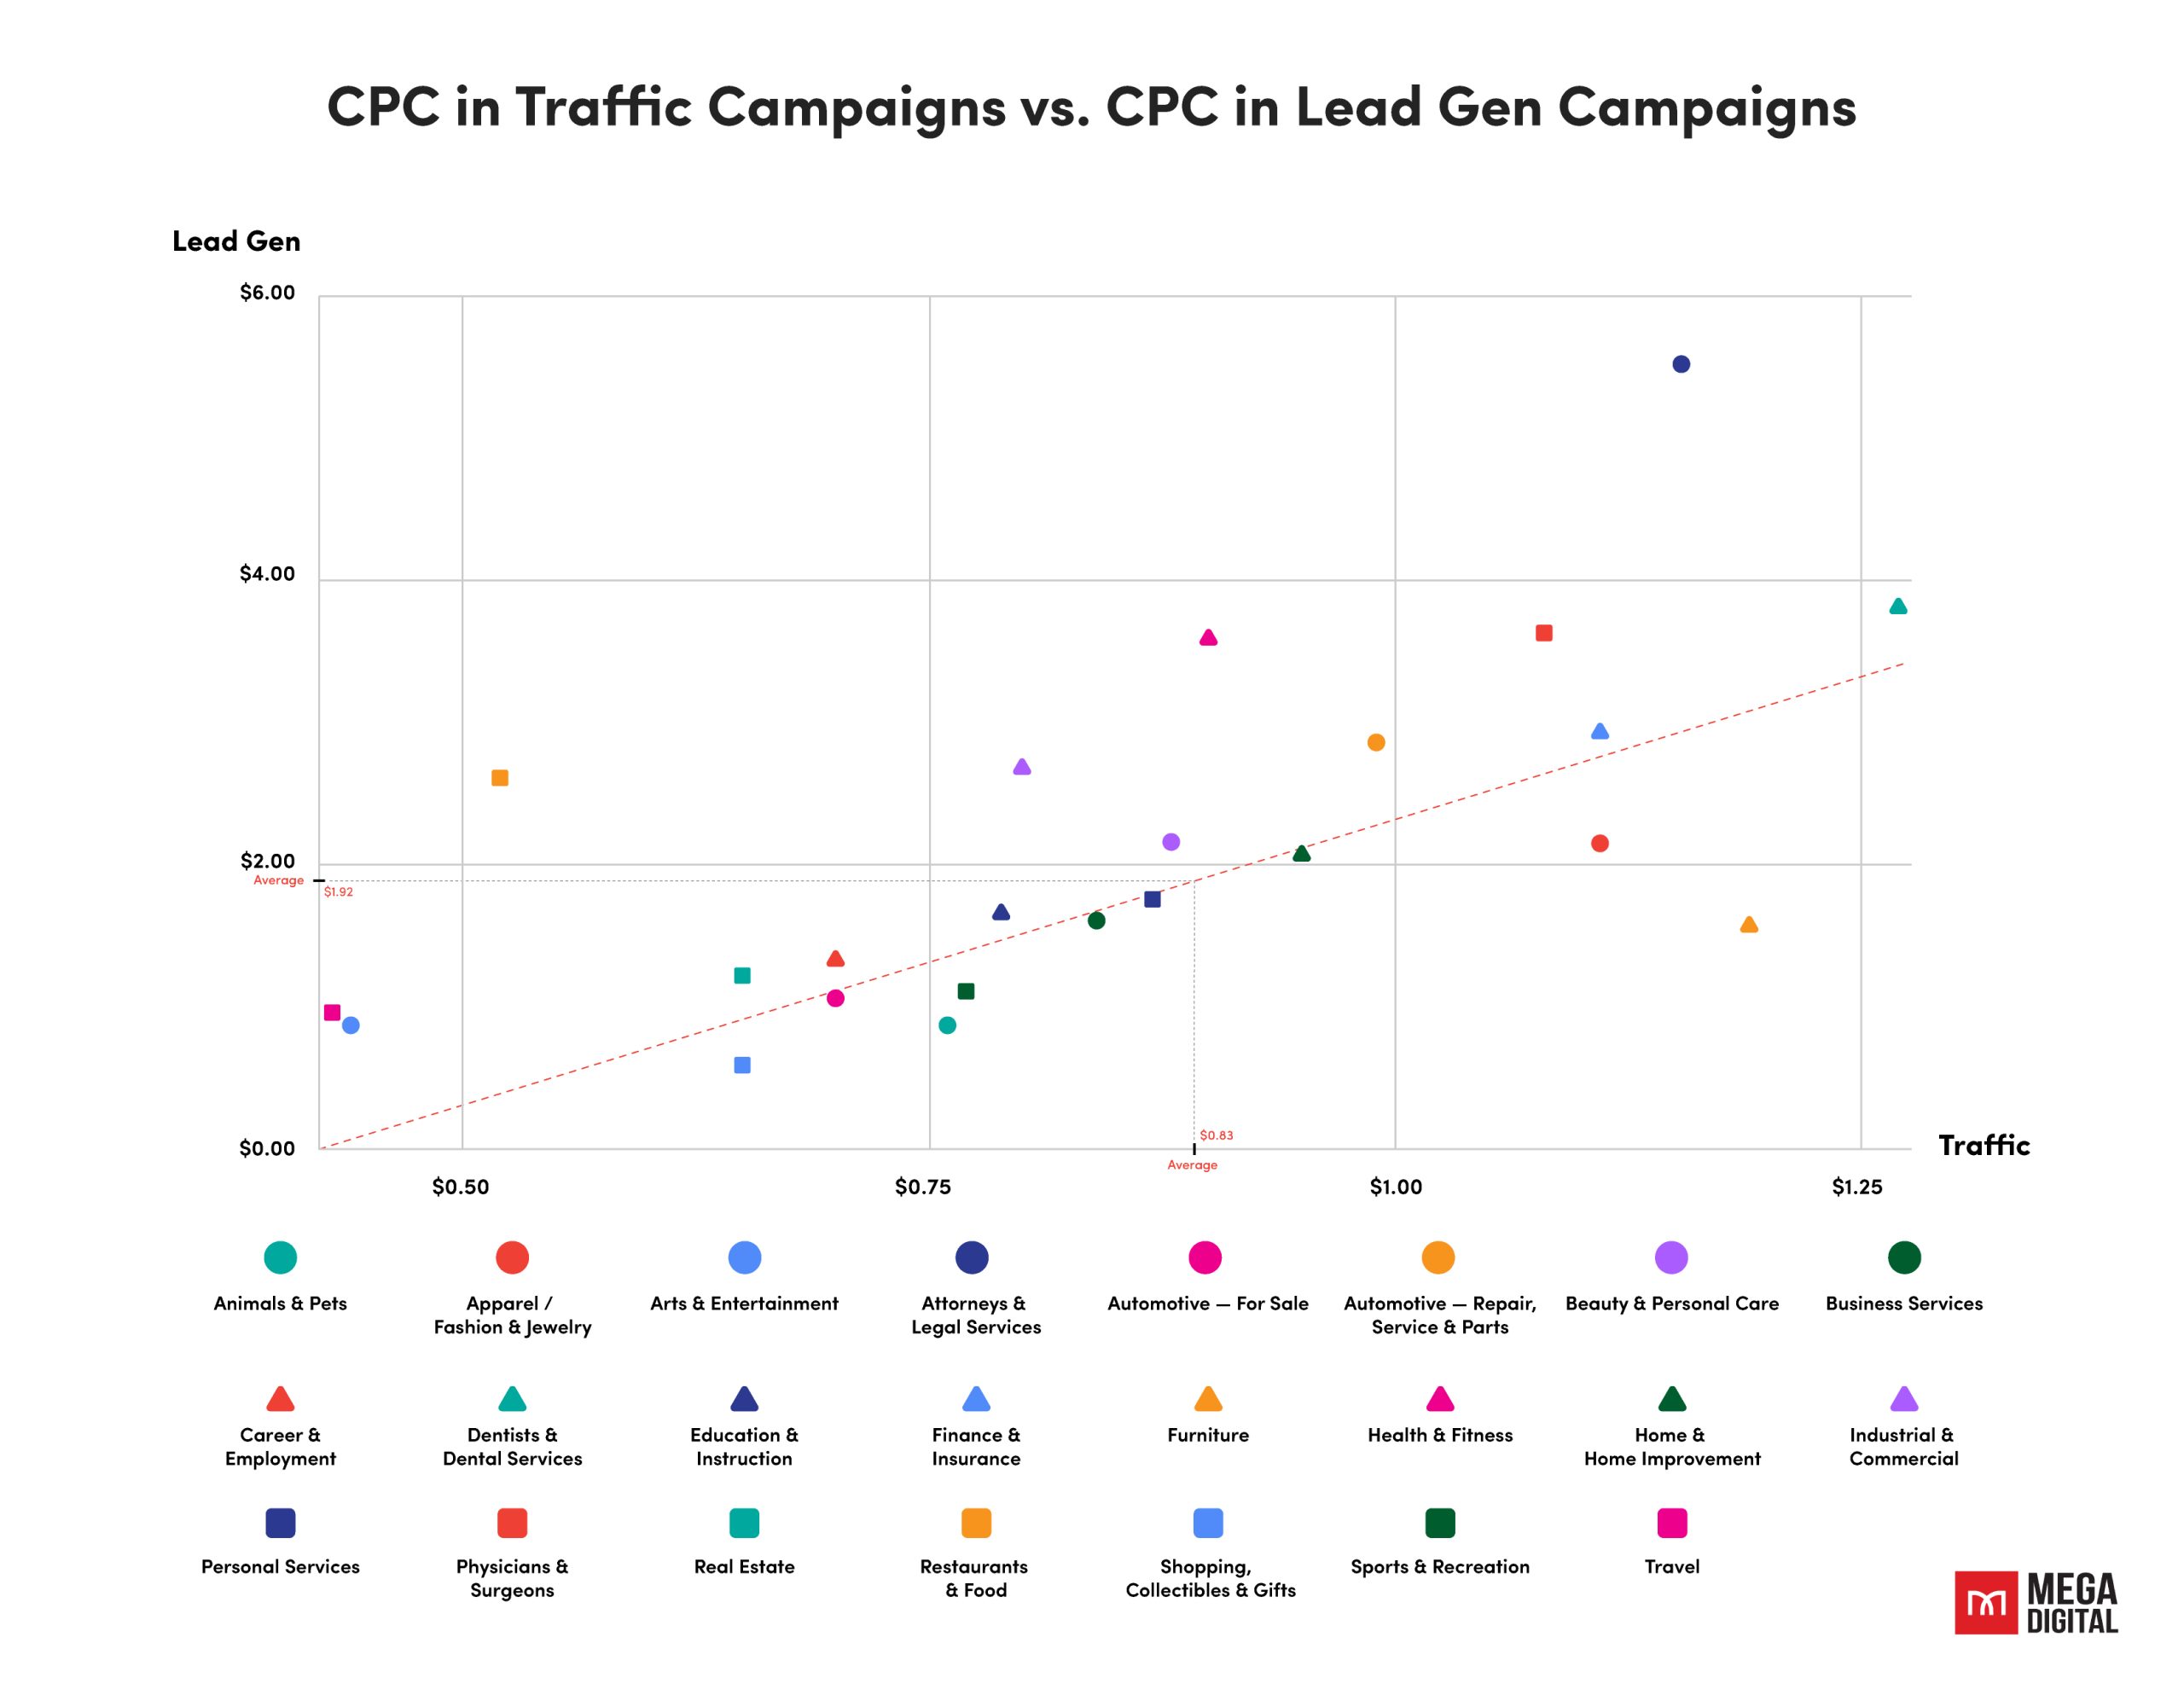
Unlike CTR (Click-Through Rate), which we explored earlier, CPC tells you how much you actually pay for those clicks.
The chart above reveals some interesting trends in CPC across various industries. Travel and Arts & Entertainment take center stage with some of the lowest CPCs, both for traffic and lead generation campaigns. This could be due to a couple of factors:
- Seasonal Swings: Travel interests ebb and flow, potentially leading to lower competition and cheaper clicks during off-peak times.
- Broader Audience: These industries might target wider demographics with less specific needs, making clicks more affordable.
Now, remember that high CTR doesn’t always equal success if the CPC is sky-high. That’s where this chart comes in. Industries like Legal Services and Dental Services might boost high CTRs with captivating ad creatives, but the chart suggests they also have some of the highest CPCs. This is likely because these are high-value purchases, where users are more cautious in their search, leading to a more competitive advertising landscape and, ultimately, pricier clicks.
So, what can you do with this knowledge?
- Brand Awareness vs. Lead Generation: Are you aiming for brand recognition, like real estate or restaurants? Traffic campaigns, often with lower CPCs, might be ideal for driving general website traffic.
- Capturing High-Intent Clicks: For legal or dental professionals seeking leads, lead generation campaigns, despite potentially higher CPCs, might be more effective in capturing those high-intent clicks from users actively searching for solutions.
Average Facebook CVR
Conversion rate (CVR) is a metric that measures the percentage of users who completed a desired action after clicking on your ad.
The average conversion rate (CTR) for Facebook ads in lead gen campaigns across various industries is 8.25%.
Industries with the most impressive conversion rates (CVRs) for Facebook ads optimized for lead generation included:
- Dentists & Dental Services at 11.34%
- Industrial & Commercial at 10.13%
- Arts & Entertainment at 9.77%.
Conversely, sectors with lower-than-average conversion rates were:
- Travel with at 3.95%
- Beauty & Personal Care at 4.61%
- Physicians & Surgeons at 4.99%.
| Business Category | Avg. conversion rate |
| Arts & Entertainment | 9.77% |
| Attorneys & Legal Services | 5.92% |
| Automotive — Repair, Service & Parts | 5.35% |
| Beauty & Personal Care | 4.61% |
| Business Services | 7.57% |
| Career & Employment | 7.02% |
| Dentists & Dental Services | 11.34% |
| Education & Instruction | 8.05% |
| Finance & Insurance | 5.62% |
| Furniture | 7.29% |
| Health & Fitness | 5.76% |
| Home & Home Improvement | 8.90% |
| Industrial & Commercial | 10.13% |
| Personal Services (Weddings, Cleaners, etc.) | 8.76% |
| Physicians & Surgeons | 4.99% |
| Real Estate | 9.58% |
| Restaurants & Food | 5.63% |
| Sports & Recreation | 8.24% |
| Travel | 3.95% |
Average Facebook CPA
Cost Per Acquisition (CPA) is a metric used to measure the cost of acquiring a lead, typically including a prospective customer’s contact information or other actionable data.
The average Cost Per Acquisition (CPA) for Facebook ads in lead gen campaigns across various industries is $23.10.
Industries with the most cost-effective Cost Per Acquisition (CPA) rates in Facebook’s leads objective category included:
- Real Estate at $12.43
- Arts & Entertainment at $13.46
- Sports & Recreation at $15.33
Conversely, sectors experiencing higher CPAs for lead generation objectives were:
- Attorneys & Legal Services at $78.26
- Health & Fitness at $60.95
- Physicians & Surgeons at $60.95
| Business Category | Avg. cost per lead |
| Arts & Entertainment | $13.46 |
| Attorneys & Legal Services | $78.26 |
| Automotive — Repair, Service & Parts | $58.56 |
| Beauty & Personal Care | $52.46 |
| Business Services | $22.65 |
| Career & Employment | $18.17 |
| Dentists & Dental Services | $29.08 |
| Education & Instruction | $27.94 |
| Finance & Insurance | $30.88 |
| Furniture | $29.08 |
| Health & Fitness | $60.95 |
| Home & Home Improvement | $20.49 |
| Industrial & Commercial | $37.71 |
| Personal Services (Weddings, Cleaners, etc.) | $19.49 |
| Physicians & Surgeons | $60.95 |
| Real Estate | $12.43 |
| Restaurants & Food | $45.15 |
| Sports & Recreation | $15.33 |
| Travel | $26.05 |
Average Facebook ROAS
There’s no strict standard for an average ROAS on Facebook; it varies based on the industry and campaign objectives.
For long-established companies or eCommerce businesses, a ROAS of 1.25x, 2x,… is generally considered successful
Self-assessing and adjusting Facebook Ads campaigns can be difficult, especially for those with less experience. If you’re struggling with data analysis and decision-making, seeking help from experienced professionals can be beneficial.
What do Mega Digital’s Experts Conclude?
4 Benchmarks of Facebook Ads
| Facebook Ads Benchmarks | 2024 | 2025 | % changes |
| Average CTR | 0.9% | 2% | 122% |
| Average CPC | $1.72 | $1.38 | -19.8% |
| Average CVR | 9.21% | 8.25% | -10.4% |
| Average CPA | $5.84 | $23.10 | 295.5% |
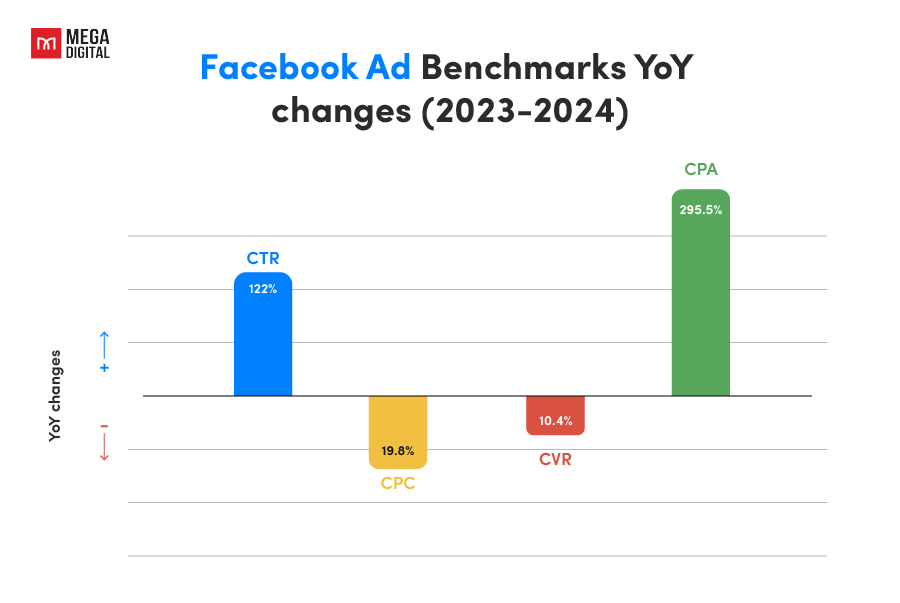
CTR
The CTR in 2025 has doubled compared to 2024. This indicates two possible scenarios:
- The trend of shopping through Facebook ads is increasing. Specifically, with Meta’s update to Reels ads, viewers are staying engaged longer and clicking more.
- Advertisers in the market are creating higher-quality ads. To improve your business’s CTR, you can study how competitors are advertising their products and services, and after that, you can adjust your ads accordingly.
CPC
Due to better ad quality (as evidenced by the CTR), the cost that businesses need to pay for ads has become cheaper this year.
CVR:
Despite the increase in CTR and the decrease in CPC, CVR has declined.
The economy is in a recession, so users are focusing their spending on essential products for their daily needs.
For example, in the travel industry, the current CVR is only 3.95%.
CPA:
The average cost per lead has increased nearly fourfold, indicating the highly competitive market. This is because many competitors are in the same industry.
Furthermore, maybe, the number of customers purchasing the product is decreasing.
CTR vs. CPC in Traffic Campaigns
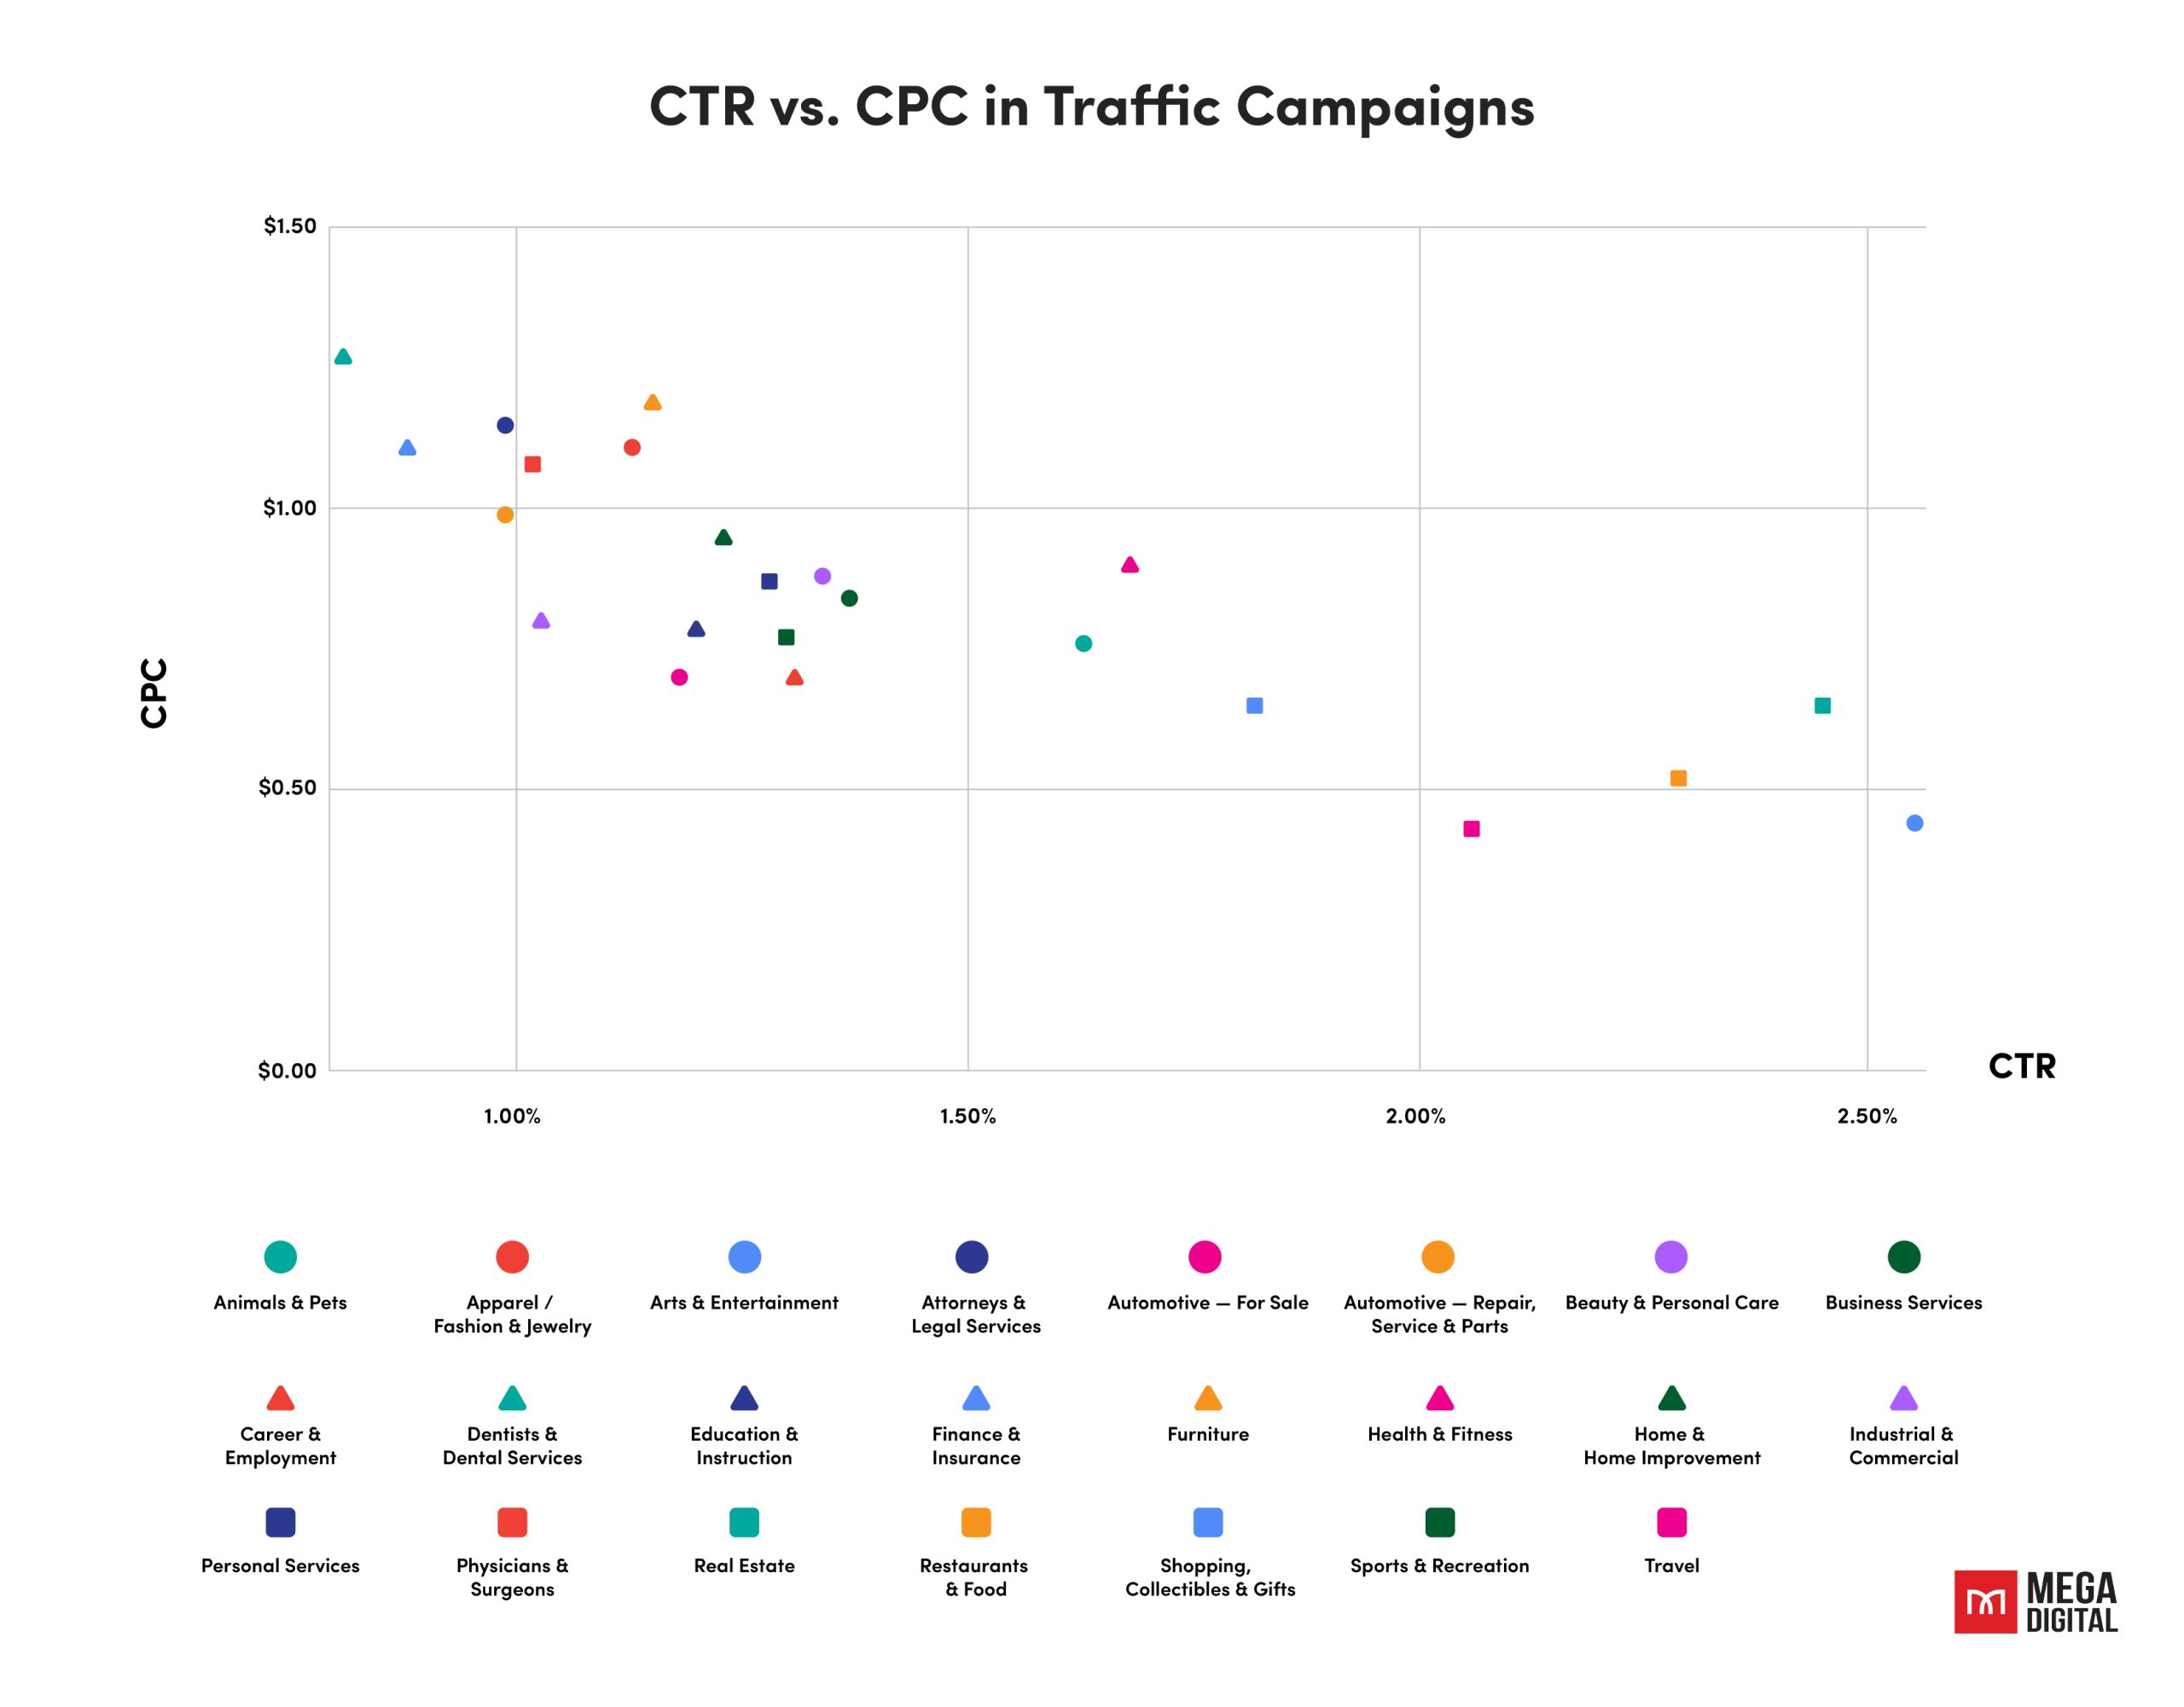
Industries that you should consider running Facebook Traffic campaigns to have high CTR and low CPC are:
| Industry | CTR | CPC |
| Arts & Entertainment | 2.55% | $0.43 |
| Real Estate | 2.45% | $0.65 |
| Restaurants & Food | 2.29% | $0.44 |
| Travel | 2.06% | $0.52 |
| Shopping, Collectibles, & Gifts | 1.82% | $0.70 |
With industries like Dentist and Furniture, which have high CPC and low CTR, they should:
- Focus on Specific Services: Instead of promoting general services, highlight specific services and features that address common concerns in the target audience.
- Optimize Landing Pages: Ensure your landing page is mobile-friendly, loads quickly, and seamlessly guides users toward the desired action
CTR vs. CPC in Lead Gen Campaigns
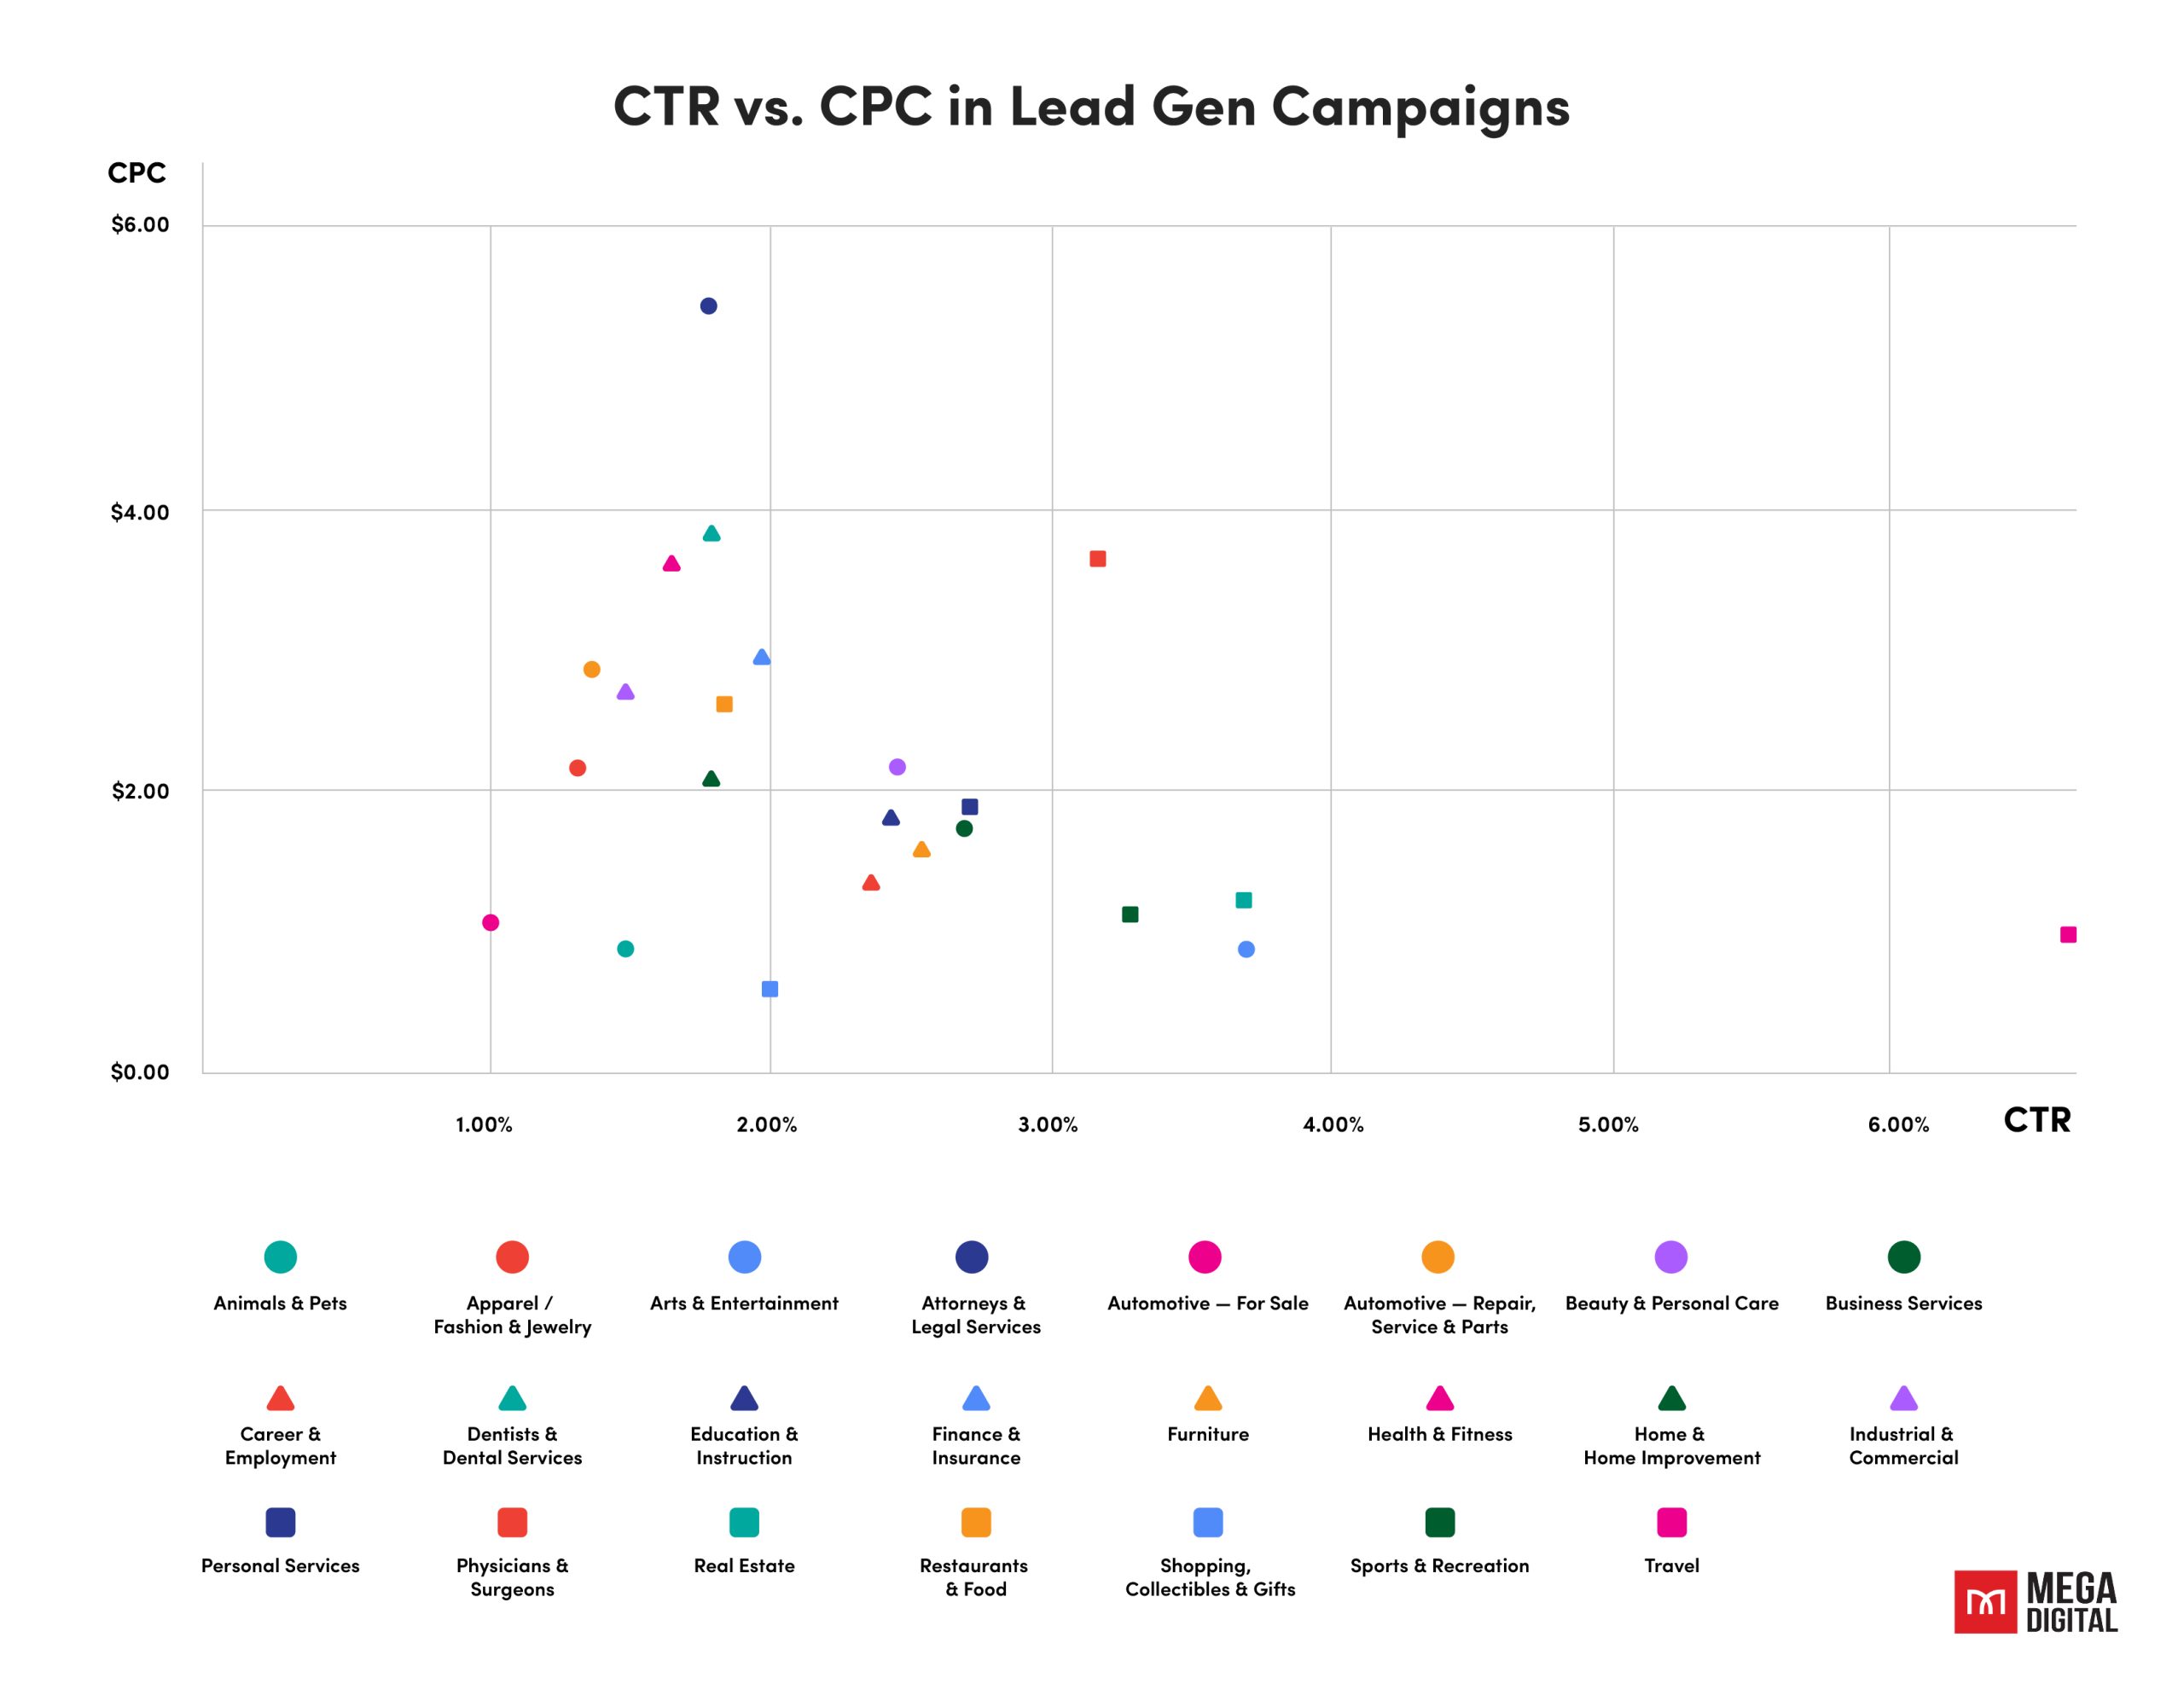
Here’s a breakdown of which industries might be well-suited for Facebook Lead Gen Campaigns in 2025:
| Industry | CTR | CPC |
| Shopping, Collectibles, & Gifts | 2.72% | $1.88 |
| Business Services | 2.70% | $1.73 |
| Real Estate | 3.69% | $1.22 |
| Sports & Recreation | 3.29% | $1.11 |
| Travel | 6.62% | $0.96 |
Travel and Arts & Entertainment have higher CTR and lower CPC than other industries in Lead Gen campaigns due to a couple of reasons:
- Less Competitive Bidding: These industries might have fewer advertisers, leading to lower bidding wars on ad placements.
- Engaging Content: These industries excel at crafting visually appealing and emotionally evocative content that captures user attention and sparks curiosity, leading to clicks.
About industries like Legal Services, Finance & Insurance, Health & Fitness, etc. have low CTR but high CPC because:
- Longer Conversion Funnel: Decisions related to these services might involve more research and consideration, so advertisers may have to pay more to get customers.
- Lower Trust & Credibility: Building trust with potential customers can be more challenging in these industries with the Facebook ad format.
So, what can you do with this knowledge?
- Strong Targeting Strategies: Utilize Facebook’s advanced targeting options to reach users who are most likely to be interested in the specific industries being advertised.
- Leverage Credibility Indicators: Include trust signals like awards, certifications, or positive customer testimonials within the ad to improve click-through rates.
Final word
In conclusion, I hope this data of Facebook Ads benchmarks proves valuable for your business endeavors. By staying adaptable and responsive to insights gained from data analysis, you can make informed decisions to optimize your Facebook Ads campaigns and drive better results for your business. If you have any further questions or need assistance, feel free to reach out for support.
![[NEWS] Mega Digital Launches New Advertiser Activation Program for TikTok - Q2 2026](https://megadigital.ai/wp-content/uploads/2026/04/TikTok-Advertiser-Activation-Program-1.webp)