Cost per result (CPR) is one of the most important metrics that advertisers use to evaluate the efficiency of their Facebook ads campaigns. But what is a good CPR? And how should you optimize your campaigns to achieve the optimal cost per result? All these questions will be addressed in this article!
What is Cost Per Result?
Cost Per Result indicates how much it costs to achieve a specific outcome or action, such as a click, conversion, impression, or any other desired result defined by the campaign objective.
CPR is one of the most crucial ad metrics in Facebook Ads. It helps advertisers measure the efficiency and effectiveness of their campaigns.
How to Calculate Cost Per Result?
You can calculate Cost Per Result based on this formula:
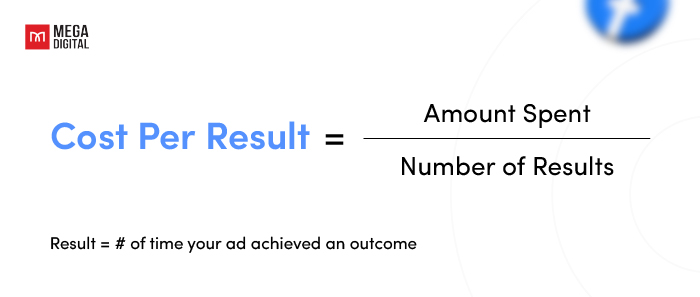
Here’s a step-by-step breakdown of how to use this formula:
- Total Spend: The total money spent on the campaign, found in the Facebook Ads Manager under ‘Amount Spent.’
- Number of Results: The total actions taken that match your campaign objective (clicks, conversions, leads, app installs, etc.), are available in the Facebook Ads Manager.
Example:
Suppose you are running a campaign aimed at generating leads for your business. Over the course of the campaign, you spend $500, and you generate 50 leads. Using the formula:

This means that it costs you $10 to generate each lead.
Cost Per Result Goal
The Cost Per Result goal in Facebook Ads is a bid strategy option provided by Meta, designed to help advertisers control their ad spend more effectively. This strategy allows you to set a specific cost you’re willing to pay for each desired action, such as clicks, conversions, or app installs. By setting a CPR goal, you instruct Facebook on how to bid in the ad auction to achieve your desired results within your specified budget.
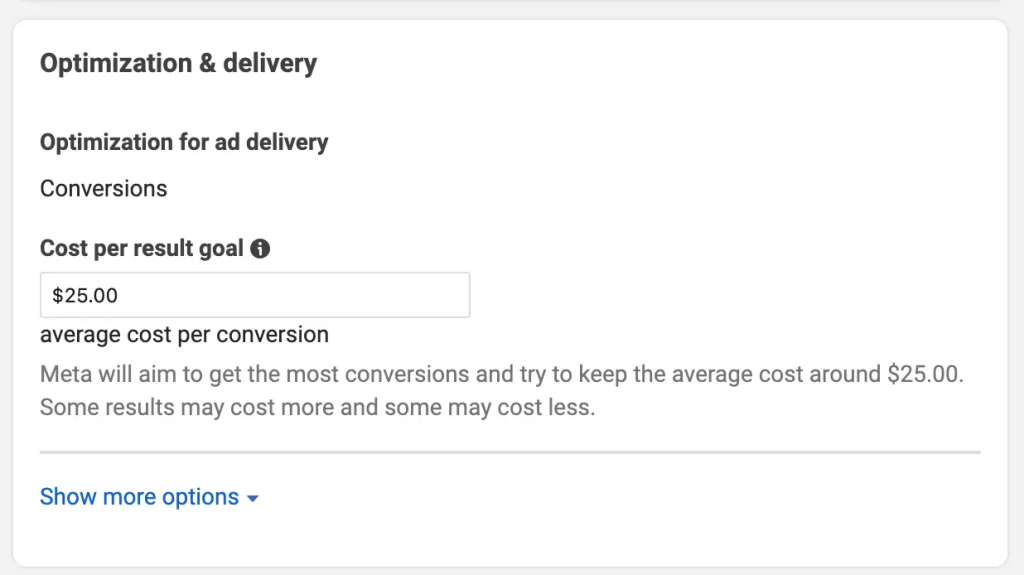
Let’s take a look at this example to see how businesses calculate and set their cost per result goal.
For example, an online clothing store wants to drive sales through Facebook Ads. They analyze their profit margins and determine that they can afford to spend $10 for each sale while still making a profit. They set their CPR goal to $10, instructing Facebook to bid accordingly in the ad auction. This way, they can maximize their ROAS by ensuring each conversion stays within their budget.
Why is Cost Per Result Important?
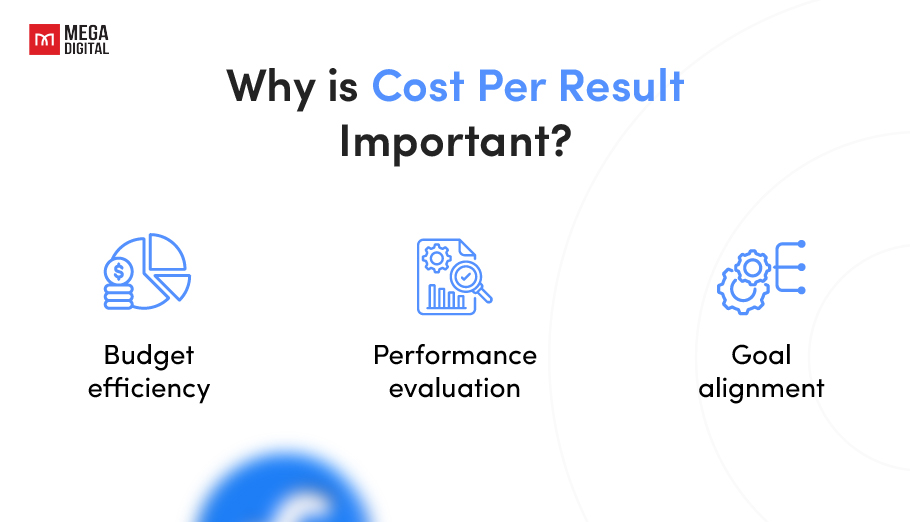
Measuring Cost Per Result is essential for Facebook advertisers aiming to maximize their return on investment (ROI) and achieve their marketing objectives efficiently. Here are several compelling reasons why tracking this metric is crucial:
Budget efficiency
Understanding your CPR helps in allocating your budget more effectively. By identifying which campaigns or ad sets yield the lowest CPR, you can focus your spending on the most cost-efficient strategies. This ensures that every dollar spent on advertising contributes to achieving your business goals.
Performance evaluation
CPR provides a clear indication of how well your ads are performing relative to their cost. By regularly monitoring this metric, you can gauge the effectiveness of different ad creatives, targeting options, and overall campaign strategies. This enables you to make data-driven decisions to enhance performance.
Goal alignment
Every ad campaign is designed with specific objectives in mind, such as generating leads, driving website traffic, or increasing app installs. Measuring CPR allows you to track how cost-effectively these objectives are being met. If your CPR is higher than expected, it may signal the need to reassess and refine your campaign approach.
What is a Good/Bad Cost Per Result in Facebook Ads?
Understanding what constitutes a good or bad Cost Per Result in Facebook Ads is crucial for optimizing your ad campaigns. A good or bad CPR in Facebook Ads can be determined subjectively and depends on factors like industry benchmarks, campaign goals, and specific actions measured:
What is a Good Cost Per Result?
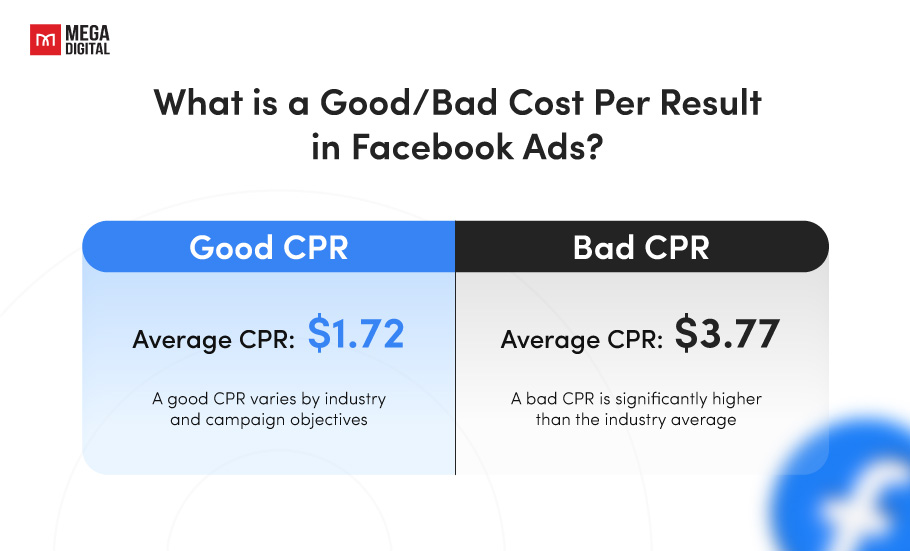
A good Cost Per Result in Facebook Ads varies greatly depending on industry and campaign objectives. On average, a CPR of around $1.72 is considered good across various sectors. Achieving a good CPR involves optimizing ad spend, creative quality, and audience targeting. For example, e-commerce campaigns might aim for a CPR lower than this benchmark to ensure cost-effective conversions.
What is a Bad Cost Per Result?
Conversely, a bad CPR is significantly higher than the industry average, indicating inefficiencies. Industries like finance and insurance often see higher CPRs, averaging around $3.77. If your campaign’s CPR exceeds these benchmarks, it may be time to reassess your strategy, targeting, and ad quality to reduce costs and improve efficiency.
How to Check Facebook Ads Cost Per Result?
To check the Cost Per Result in Facebook Ads Manager, follow these steps:
Step 1: Navigate to Ads Manager
Log in to your Facebook account and go to the Ads Manager dashboard.
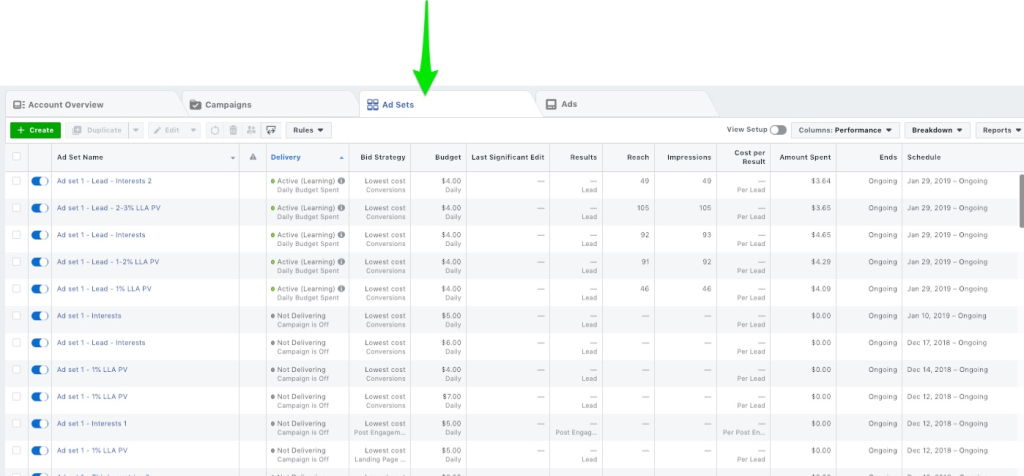
Step 2: Navigate to the Ad Sets tab
Click on the ‘Ad Sets” tab at the top of the dashboard.
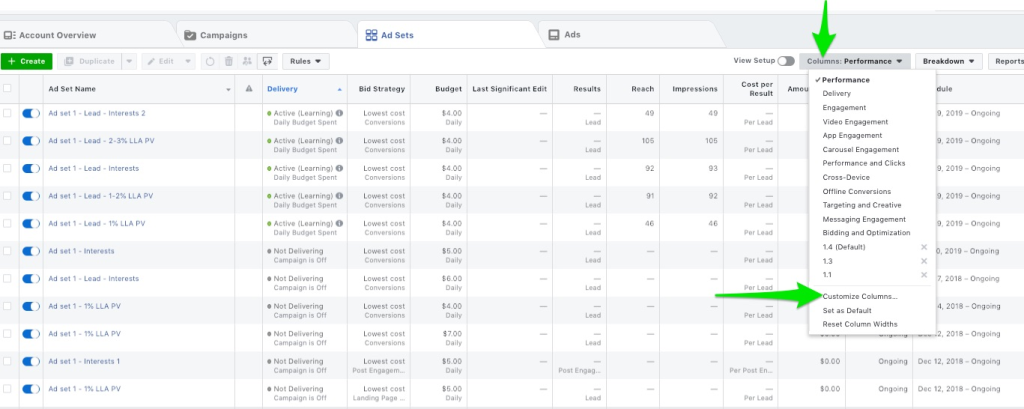
Step 3: Customize Columns
Click on the “Columns” drop-down menu and select “Customize Columns.”
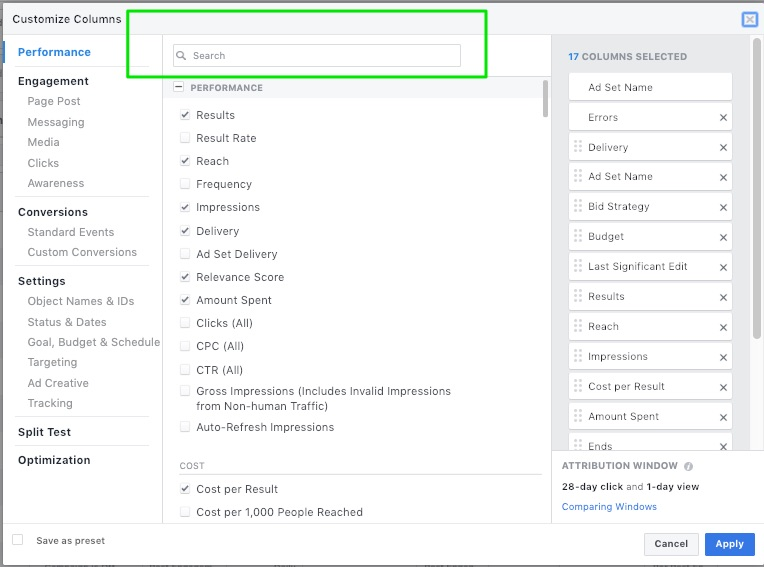
Step 4: Add Cost Per Result
In the customize columns window, search for “Cost Per Result” and add it to your columns. Click “Apply” to save the changes.
The CPR metric will now be visible in your campaign overview, allowing you to monitor and evaluate the cost-efficiency of your ads.
Best Practices to Optimize Cost Per Result
Optimizing the CPR in Facebook Ads is crucial for maximizing your return on investment. Here are some best practices to achieve this:
1. Use Strong Images and Videos
Visually appealing content captures attention quickly, driving higher engagement and lower CPR. High-quality images and videos create a more compelling ad experience.
Invest in professional photography and videography. Use vibrant colors, clear messaging, and dynamic visuals that resonate with your target audience.
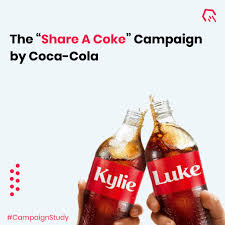
A real-Life example from Coca-Cola: During their “Share a Coke” campaign, Coca-Cola used personalized bottle images and engaging videos. This campaign achieved a 2.5x increase in ad engagement and a 20% reduction in CPR by leveraging strong visuals.
2. Experiment with Different Campaign Objectives
Different objectives align better with various stages of the customer journey, optimizing ad delivery for specific goals and improving cost efficiency.
Test various objectives like brand awareness, conversions, and app installs. Analyze performance data to identify which objectives yield the lowest CPR.
A real-life example from Airbnb: Airbnb initially focused on app installs but shifted to bookings, achieving a 30% decrease in CPR. This change helped them target users more likely to complete a booking, optimizing ad spend.

3. Incorporate a Relevant Landing Page
A relevant landing page ensures that users who click on your ad find exactly what they were expecting, which improves user experience and increases conversion rates, leading to a lower CPR.
Ensure your landing page aligns with the ad’s message and provides a seamless user journey. The page should be optimized for speed, mobile-friendly, and include clear calls-to-action that guide users toward the desired outcome.
A real-life example from Airbnb: Airbnb created landing pages specifically tailored to their various ad campaigns, highlighting unique features and experiences relevant to the targeted audience. This approach led to a 22% reduction in CPR and a 35% boost in booking rates.

4. Optimize Your Ad Targeting
Precise targeting ensures ads are shown to users most likely to engage, leading to higher relevance scores and lower CPR.
You can use Facebook’s detailed targeting options to segment your audience based on demographics, interests, and behaviors. Continuously refine your audience based on ad performance data.
A real-life example from Nike: Nike segmented their campaigns to target specific groups like athletes and casual wearers. This approach resulted in a 25% lower CPR and a 40% increase in engagement rates. Their tailored ad experiences resonated well with each audience segment, improving overall campaign efficiency.

By implementing these best practices, you can effectively optimize your CPR, and make the most of your ad spend.
If you’re still struggling with CPR optimization, don’t hesitate to drop a message by clicking the button below. Our agents will reach out and consult with you personally.
3 Reasons for High Cost Per Result in Facebook Ads
Understanding why your cost per result is higher than expected is crucial for optimizing your campaigns and ensuring your ad spend is effective. Here are three common reasons for high CPR and how you can address them:
1. Poor Targeting
Ineffective targeting (both too broad or too narrow) leads to ads being shown to uninterested users, resulting in low engagement and conversions. This inefficiency increases your CPR.

Solution:
To improve CPR, make sure your ads target the right people. Facebook has many options to target your audience. Here’s how you do it:
- Audience Segmentation: Use detailed insights to segment your audience based on demographics, interests, and behaviors.
- Lookalike Audiences: Use Facebook’s Lookalike Audience feature to reach new users similar to your existing customers.
- Continuous Testing: Regularly test different targeting options and refine based on performance data.
The more accurate your targeting, the less you might need to spend to reach people who are genuinely interested in your ads.
Example: A fashion retailer narrowed their audience to women aged 18-35 interested in similar brands, reducing their CPR by 35%.
2. Low Ad Relevance Score
Facebook’s ad relevance score is a rating on a scale of 1-10 that demonstrates how well your Facebook ad is being received by your target audience. Ads with low relevance scores (4 or less) rarely generate great results, and are punished with higher costs, as you can see in the dashboard below:
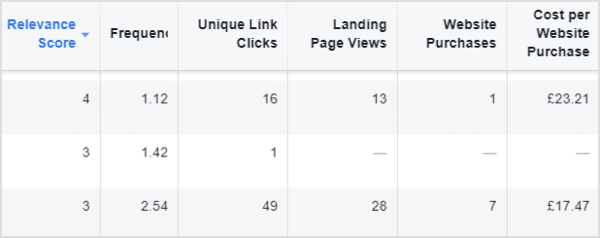
This means your ads don’t resonate with the audience or lack compelling visuals and messaging, resulting in lower engagement rates and higher CPR.
Solution:
- Improve ad creative: Use high-quality, engaging visuals and clear, compelling copy.
- Refine audience targeting: Target specific, relevant audience segments using detailed demographics, interests, and behaviors.
- Ensure ad and landing page consistency: Keep ad content and landing page experience seamless and relevant.
Example: An online retailer enhanced its ad visuals and refined its audience, increasing its relevance score by 20%, which reduced CPR by 25%.
3. High Competition
High competition in Facebook Ads leads to higher cost per result because many advertisers are bidding for the same target audience, driving up the cost of ad impressions. This increased demand raises the price you pay for each action, such as clicks or conversions, as the ad auction becomes more competitive.
Solution:
- Alternative placements: Explore different Facebook ad placements like Instagram Stories and Messenger ads.
- Unique value proposition: Highlight unique features and benefits to stand out.
- Ad scheduling: Run ads during less competitive times.
Example: A travel agency scheduled ads during off-peak hours and focused on Instagram Stories, lowering their CPR by 30%.
>>> Read more: Find the Best Time to Run Facebook Ads for Optimal Results
Closing
In conclusion, cost per result measures the cost of achieving a specific objective in Facebook Ads, making it a crucial metric for evaluating campaign efficiency and optimizing ad spend. Understanding and optimizing CPR is essential for maximizing ROI and ensuring the success of your advertising efforts. I hope this post has clarified Facebook ads cost per result, including how to calculate, check, and optimize it for your better campaign performance.
