
If you are unfamiliar with Facebook Ads and want to know if your campaign is doing good or not, then this blog is for you. I will explain to you in detail all the essential Facebook Ads metrics you will need to analyze when looking at your ad campaigns. This will help you understand what’s actually going on with your ads and what to do next after measuring it.
Overview of Facebook Ads Metrics
As you delve into Facebook Ads, it’s essential to focus on metrics that truly reflect the performance and impact of your campaigns. Among the vast array of over 350 metrics, I’ve distilled the key ones that will provide actionable insights and drive your advertising strategy forward.
Here are the 11 essential Facebook Ads metrics that reflect your campaign results:
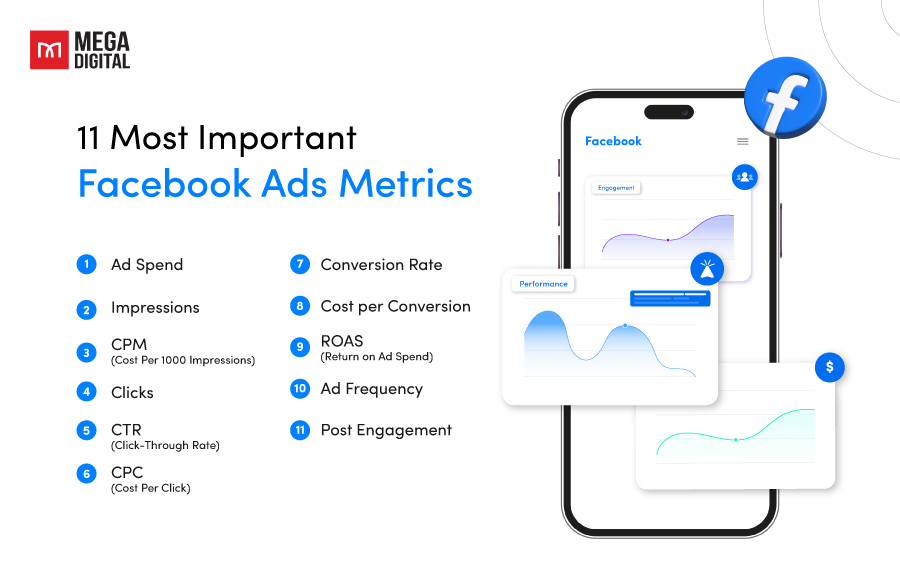
- Ad Spend: Knowing how much you’ve invested gives you the baseline for measuring ROI.
- Impressions: This shows how often your ads are being seen, which is crucial for brand awareness.
- CPM (Cost Per 1000 Impressions): This metric represents the cost an advertiser pays for every 1000 times their ad is displayed.
- Clicks: The number of clicks reflects user interest and initial engagement with your ads.
- CTR (Click-Through Rate): This ratio tells you how compelling your ads are by comparing clicks to impressions.
- CPC (Cost Per Click): Understanding the cost for each click helps manage your budget effectively.
- Conversion Rate: Seeing the percentage of clicks that lead to conversions informs you about the effectiveness of your ads.
- Cost per Conversion: This metric helps you understand the cost-effectiveness of your ads in driving the desired actions.
- ROAS (Return on Ad Spend): Perhaps the most critical, ROAS measures the financial return from your ad spend, indicating profitability.
- Post Engagement: Total interactions with your ads show how users are responding beyond just clicking.
- Ad Frequency: How often the average user sees your ad can affect ad fatigue and campaign performance.
These metrics were chosen for their direct relevance to campaign goals, providing a clear picture of both financial and engagement performance. They are the cornerstones for optimizing your campaigns and achieving measurable success.
Why You Need to Understand Facebook Ads Metrics?
To truly leverage the power of Facebook Ads, it’s essential to understand the metrics that track user interactions on the platform. These metrics are not just numbers; they are strategic tools that can significantly influence the optimization and success of your campaigns.
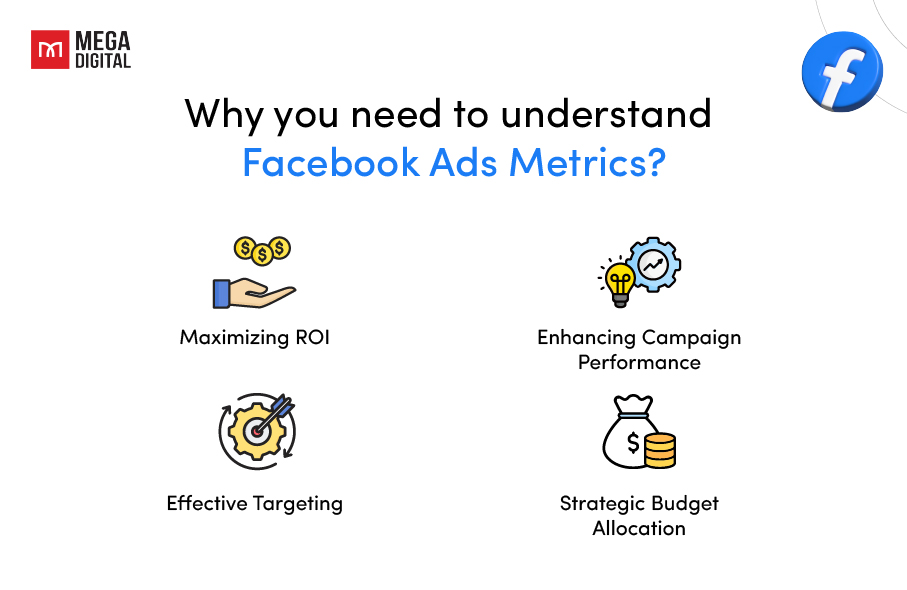
Maximizing ROI
Understanding Facebook Ads metrics allows you to measure the return on investment (ROI) effectively. By tracking metrics like ROAS, you can determine the profitability of your campaigns and adjust your strategies to maximize returns.
Enhancing Campaign Performance
Metrics provide valuable insights into the performance of your ads. By analyzing data such as CTR and Conversion Rate, you can identify areas of success and those needing improvement, enabling you to optimize your campaigns for better results.
Effective Targeting
By monitoring metrics like Impressions and Reach, you can refine your audience targeting, ensuring that your ads are seen by the people most likely to engage with your content.
Strategic Budget Allocation
Understanding which ads drive the most engagement and conversions allows you to allocate your budget wisely. Metrics such as CPC and CPA give you a clear picture of where to invest for the highest returns3.
By focusing on these key metrics, you can ensure that your Facebook Ads campaigns are finely tuned to achieve the desired outcomes, providing transparency and accountability in your advertising efforts.
11 Facebook Ads Metrics You MUST Track
To give you a better understanding, I have divided 11 Facebook Ads Metrics into 2 groups based on the analytic goals, which are:
- Engagement Metrics
- Performance Metrics
1. Engagement Metrics
Engagement metrics measure how users interact with your ads. They’re crucial for understanding how compelling your ads are to your audience.
1.1. Link Clicks
Link clicks refer to the total number of times people clicked your ad’s link.
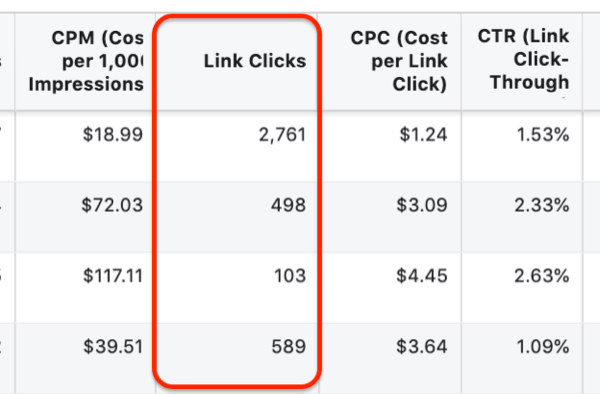
Why you should track link clicks: Clicks indicate user interest in your ad’s message and a willingness to learn more. A high number of clicks suggests your ad is successful in capturing attention and prompting action.
Where to track: In Facebook Ads Managers, go to Customize columns. Under Engagement, find the metric Link clicks. Tick it, and it will be included in the campaign report.
How to improve link clicks: Work on your ad creatives (design, copy, CTAs, etc.). Make sure they are clear, communicate value, and are not confusing. It also helps to A/B test creatives – this will help you to refine your ad and make it more effective. You can also experiment with location and time settings to make sure your ads are shown when they are most relevant.
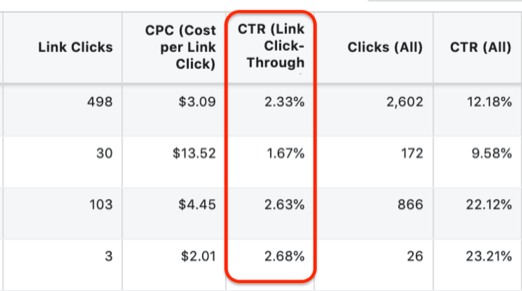
1.2. CTR (Click-Through Rate)
CTR measures the percentage of people who click on your ad after seeing it. It’s calculated using the formula:
CTR = Total Clicks/Total Impressions × 100%
A higher CTR indicates that your ad is effective at capturing users’ attention.
Why you should track CTR: CTR is a key indicator of how well your ad copy and visuals are grabbing attention and enticing users to click. A high CTR suggests your ad is relevant and compelling to your target audience.
Where to track: Go to Customize columns. Under Engagement, find the metric CTR and click on it.
How to improve CTR: Experiment with different ad types and formats and try different versions of ad copy to see what works best. You can also segment your audience into several categories with different demographics and needs. Then you can prepare a separate offer and creative assets for each of them and see how performance changes.
1.3. Post Engagement
Engagement metrics go beyond simply showing your ad. They tell you how users are interacting with your ad content. Here are some key engagement metrics to track:
- Shares: This metric shows how many times users shared your ad on their Facebook timelines.
- Comments: This metric shows how many comments users left on your ad.
- Likes: This metric shows how many times users liked your ad.
Why you should track post engagement:
Post engagement indicates how users are interacting with your ad beyond simply clicking. High post engagement proves that your ad is resonating with your audience.
Where to track: Click on Columns and select Engagement. Add Post Engagement to your columns to view metrics related to likes, comments, shares, and other interactions.
How to improve post engagement: There are several tactics use can use to improve this metric. You should post at times when your audience is most active on Facebook to maximize visibility and interaction. Incorporate interactive content like polls, quizzes, and videos to increase engagement rates. And don’t forget to use CTAs within your posts to encourage likes, comments, and shares.
2. Performance Metrics
Performance metrics measure the results of your ad campaign against your defined objectives.
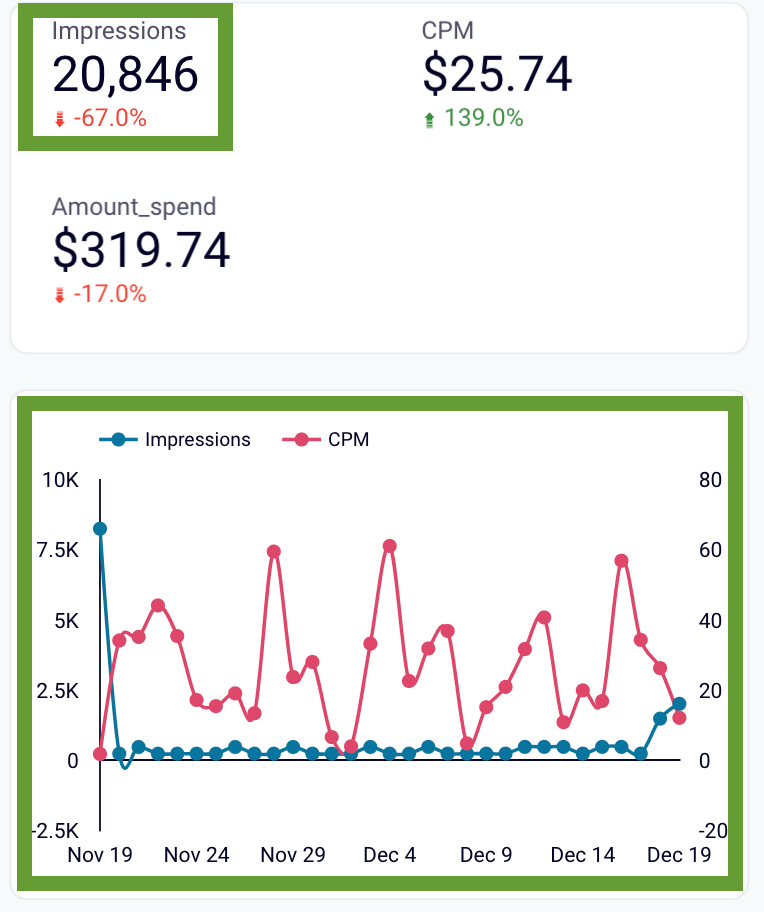
2.1. Impressions
Impressions are the metric that counts how many times your ad has been displayed to users. Facebook automatically calculates the number of impressions. Each time a user views your ads, it adds one to your impression count.
Why you should track impressions:
The number of impressions gives you a basic understanding of how many people your ads are getting in front of. A high number of impressions is a sign that you are targeting the right audience and that your bidding strategy is performing well.
However, they don’t necessarily indicate how well your ads are performing in terms of engagement or conversions. For instance, your ad might have a high impression count, but if it’s not capturing attention or prompting clicks, it might need adjustments.
Where to track: Open Facebook Ads Managers, go to the list of your Facebook Ads campaigns, and select the campaign you need. Then, click Customize columns. Under Performance, click on Impressions. After this, the Impressions column will be added to your campaign report.
How to improve: Try different ad creatives. A compelling and clear design with a crisp and relevant copy can have a significant impact on the results. Make sure it stands out in the news feed and has an engaging message. Apart from that, you can increase your bid and try to target a narrower audience.
2.2. CPM (Cost Per 1000 Impressions)
This is the average cost of 1000 impressions. It’s calculated as the following formula:
CPM = Total Spend/Total Impressions × 1000
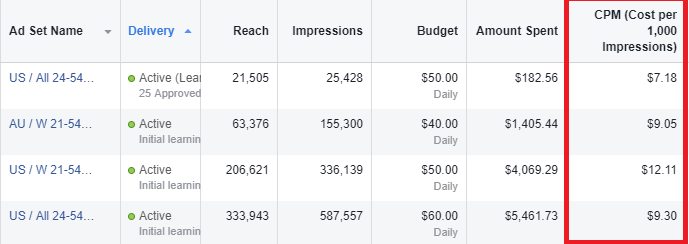
Why you should track CPM:
It measures the cost-effectiveness of an ad campaign, and is a great metric to compare ad costs across different ad publishers and campaigns. It is also helpful in understanding how pricing is fluctuating for your chosen placement.
Where to track: Go to Customize columns. Under Performance, find the metric CPM and click on it.
How to improve CPM: To achieve a lower CPM rate, you need to work on making your ads as relevant to the audience as possible. If you select narrower segments as your target audience, this will help with bringing the CPM down.
2.3. Ad Frequency
Ad frequency is the average number of times each person sees your ad. It’s calculated as Impressions / Reach.
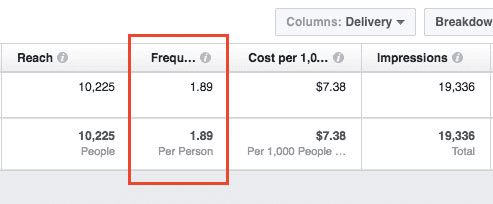
Why you should track frequency: This is an especially important metric to measure if you have a very narrow, targeted audience. Monitoring frequency helps you avoid overexposing your ad to the same audience. While people often need to see an ad multiple times before converting, if they have seen an ad 10+ times, you’re likely oversaturating your audience.
Where to track: Go to Customize columns. Under Performance, find the metric Frequency and click on it.
How to improve ad frequency: You can increase frequency by simply expanding your ad budget. However, you need to check that frequency increase correlates with a good campaign performance. If it doesn’t, this can indicate your audience developed ad fatigue. To fix this, you can use Facebook’s frequency capping feature and limit the number of times a user sees your ad.
2.4. CPC (Cost per click)
CPC (Cost Per Click) is the amount you pay for each click, on average. This metric allows you to evaluate campaign performance and the efficiency of your bidding strategy.
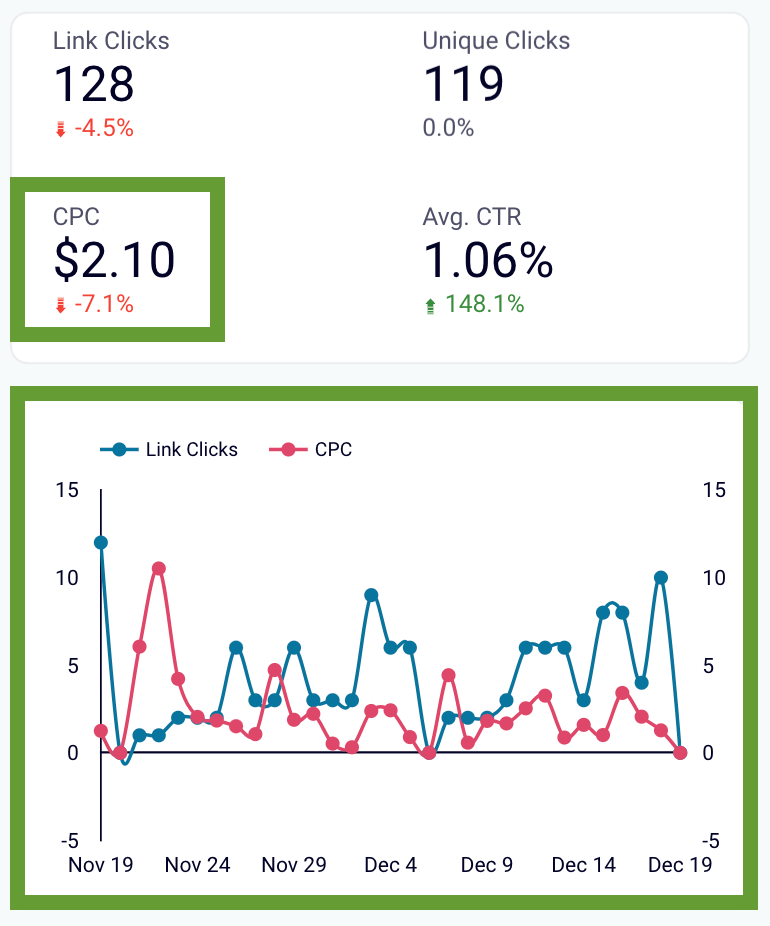
Why you should track CPC: CPC is a metric that should be closely monitored on a daily basis. When it’s low, this means your ad placement is good, creatives are engaging, and your bidding strategy and campaign settings are relevant. If the situation is different and CPC is growing, this indicates that there’s an issue somewhere, and you need to conduct a campaign audit to identify the areas for improvement.
Where to track: Go to Customize columns. Under Performance, find the metric CPC and click on it.
How to improve CPC: In general, to improve CPC, you can use more precise and narrow targeting and lookalike audiences. Then, it helps to customize your bidding strategies for each audience. You can also experiment with creatives and A/B test designs and messages.
2.5. Cost per Conversion (Cost per Result)
This is the average cost of each conversion action from your ad. It’s calculated as Total Spend / Conversions. A lower cost per result means your ad is more cost-effective.
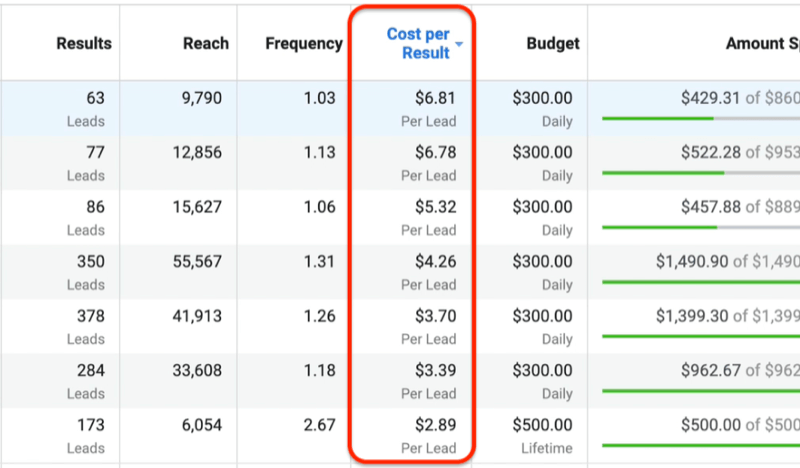
Why you should track Cost per Conversion: This metric directly ties to what you’re trying to achieve with your ad campaign. Whether it’s website visits, lead generation, or sales, “Conversions” tells you how many times your ad achieved that specific action. Therefore, you can prioritize the ads which are performing best in achieving what matters most.
Where to track: Go to Customize columns. Under Performance, find the metric Cost per Result and click on it.
How to improve it: To improve this metric, which means lowering cost per conversion, you could allocate more budget to high-performing ad sets and campaigns that drive conversions at a lower cost. Keep on optimizing your targeting, and testing different types of posts to see what drives the most conversions.
2.6. Conversion rate
Conversion rate shows the total number of times users completed a desired action, such as making a purchase, signing up for a newsletter, or downloading an app. It’s calculated as:
Conversion Rate = Total ConversionsTotal Clicks × 100%
Why you should track conversion rate: This metric goes beyond clicks and shows how successful your ad is in converting viewers into paying customers or completing other desired actions. A high conversion rate indicates your ad effectively funnels viewers towards your desired outcome. A low conversion rate suggests a need to refine your ad messaging or landing page to improve the user journey.
Where to track: Go to Customize columns. Under Performance, find the metric Conversion rate and click on it.
How to improve conversion rate: To improve your conversion rate, you can optimize your ad content to be more compelling, target your ads more accurately, and improve the user experience on your landing page. Consider using retargeting strategies to reach users who have previously interacted with your ads but have not yet converted.
2.7. Amount spend
This metric shows how much you spent on your ad campaign or an ad in total during a specified period. Your spend is estimated by Facebook automatically. While your ad is still running, it may take up to 48 hours for this information to update, that’s why you get an estimation.
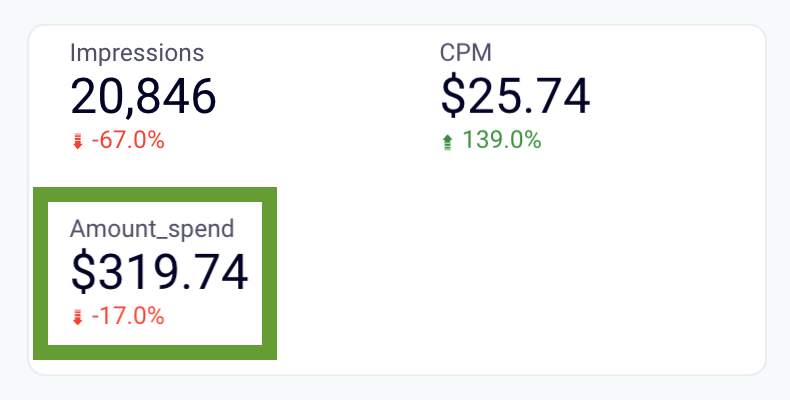
Why you should track Amount Spend: Monitoring your ad spend is essential for budget management. It also allows you to analyze the return on investment (ROI) for your campaign. If you notice that you’re spending a lot on a campaign that’s not generating enough results, it might be time to reassess your strategy.
Where to track: Go to Customize columns. Under Performance, find the metric Amount spend and click on it.
How to improve it: Analyze your data regularly and make sure you allocate the biggest chunks of budget to the best-performing campaigns, ads, and KW groups. You can also experiment with the targeting settings and your bidding strategy to optimize ad cost.
2.8. ROAS (Return on Ad Spend)
This is the total conversion value divided by the total ad spend. It’s calculated as:
ROAS = Conversion Value/Total Ad Spend × 100%
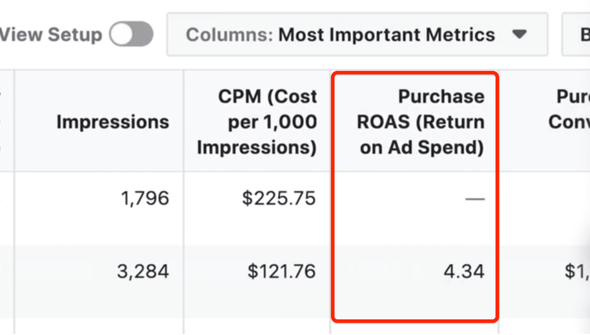
Why you should track ROAS: Tracking ROAS is crucial because it helps you understand the profitability of your ad campaigns. A high ROAS indicates that your ad spend is translating into significant revenue, while a low ROAS might suggest that your ad spend is not leading to enough sales to justify the cost.
Where to track: Go to Customize columns. First, select Conversions and then click on Purchase ROAS. If you want to sum up the return on ad spend for all purchases made as a result of your ads, click on Total.
How to improve ROAS: This metric reflects the outcomes of many processes and funnel stages that lead from seeing an ad to making a purchase. So, in order to improve ROAS, you need to work on all the components of a successful user journey. From polishing creative assets and targeting the right audience to optimizing ad placements and bidding strategies.
Phew? That’s a lot to cover! Just remember, analyzing Facebook ad metrics is crucial in evaluating the effectiveness of your ad campaigns. These metrics provide valuable insights into your audience’s behavior, engagement levels, and conversion rates, enabling you to optimize your ads for better performance.
Even after analyzing all of the metrics above, how do you know whether your Facebook ad campaigns perform well or not, at least compared to your competitors? Well, by comparing your campaign’s performance with industry benchmarks, you can gain a clearer picture of where you stand in your market.
>>> Read more: Facebook Ads Benchmarks for 19 Industries: What Experts Say?
How to track your key Facebook Ads metrics with Power BI?
The most important metrics for Facebook Ads should be monitored on a very regular basis. Although you can track them directly in Facebook Ads, it’s not the most optimal way.
Many marketers prefer to track Facebook Ads metrics in an external dashboard. And Power BI is one powerful data visualization and business intelligence tool that you can utilize.
Here’s a step-by-step guide on how to track your key Facebook Ads metrics and create an easy-to-track dashboard with Power BI:
Step 1: Connect Facebook Ads to Power BI
The first step is to establish a connection between Facebook Ads and Power BI. To do this, follow these steps:
- Open Power BI and navigate to the Home tab.
- Click on Get Data.
- Select More from the dropdown menu.
- Navigate to Online Services.
- Select Facebook Ads.
- Enter your Facebook Ads credentials to establish the connection.
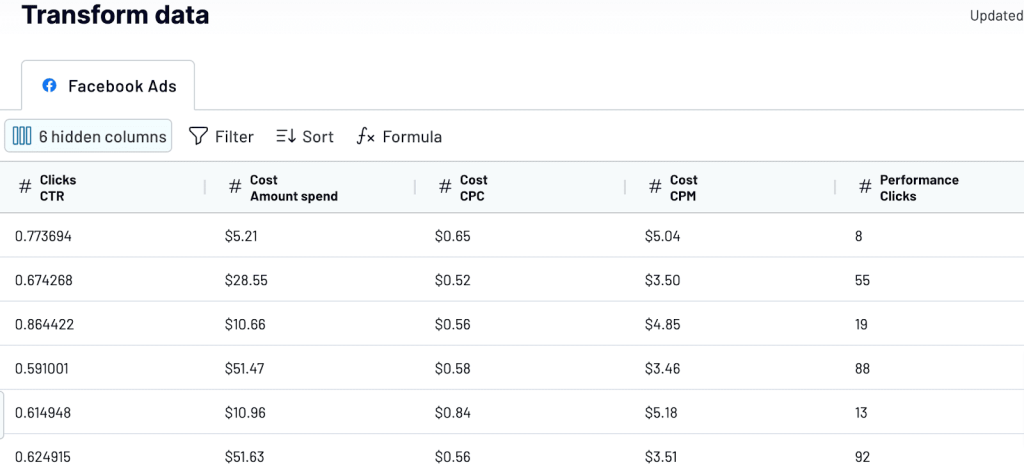
Step 2: Import and Transform Data
After you establish the connection, follow these steps to import and transform your data:
- Get Data: Click on the “Get Data” button in Power BI and select your connector. Follow the prompts to import your Facebook Ads data.
- Transform Data: Clean and transform your data to ensure accuracy. Power BI offers tools for data modeling, merging tables, removing duplicates, and applying filters.
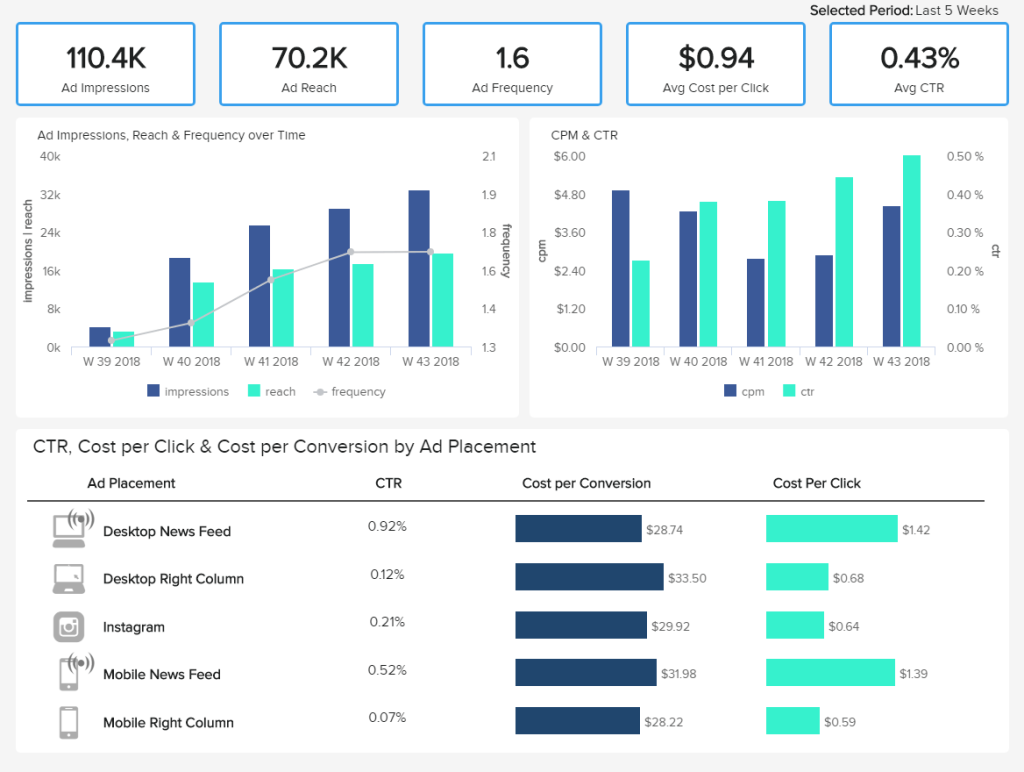
Step 3: Create Interactive Dashboards
With your data imported and cleaned, you can now create interactive dashboards. Remember to use Power BI’s wide range of visualization options (charts, tables, maps, custom visuals) to design your dashboard. Common metrics to visualize include impressions, clicks, conversions, ad spend, engagement rate, and click-through rate (CTR).
Step 4: Share and Collaborate
Once your dashboard is ready:
- Publish and Share: Share your dashboard within your organization or with clients. Power BI allows you to publish dashboards to the web, embed them in other applications, or share them with specific individuals or groups.
- Automate Data Refresh: Set up scheduled data refreshes to ensure your dashboards always display the most up-to-date information.
Conclusion
Understanding Facebook Ads metrics is crucial for any advertiser. These metrics provide valuable insights into your ad’s performance and can help you make data-driven decisions to optimize your campaigns. Remember, the key is to understand what each metric represents, look at multiple metrics together, and compare metrics over time.