YouTube is no doubt a platform with advertising potential to explore, which means more and more advertisers are becoming attracted to it. It is important to know how your YouTube Ads campaigns are performing, and if you want to do that, the easiest way is comparing your metrics to the benchmarks of other advertisers. In this article, I have made a comprehensive compilation of all YouTube Ad benchmarks you should know.
QUICK SUMMARY
- Benchmarks are drawn from proprietary Google data (via Mega Digital as a top APAC Google Partner) and thousands of client campaigns (Jan–Sep 2024).
- Key metrics covered: CTR (avg. 0.65%), View Rate (avg. 31.9%), CPV (avg. $0.026), and CPM (avg. $3.53), with wide variations by industry.
- High CTR industries include Travel (0.78%) and Retail (0.84%), while Restaurants and Household Essentials sit at the bottom.
- CPV peaks in Healthcare & Insurance ($0.071), while CPM is lowest in Automotive ($2.90) and highest in Healthcare ($7.10).
- Actionable strategies: scale winning creatives/CTAs, expand audience segments, test formats, and for underperforming campaigns, refine targeting, adjust messaging, and pause weak elements.
Where did these YouTube Ad benchmarks come from?
With more than 7 years of practical experience as a Google Ads specialist at Mega Digital (acknowledged as a top Google Partner in APAC), I consistently receive proprietary data, including heatmaps and benchmarks, directly from Google.
In addition to the information obtained directly from Google, I’ve compiled data from thousands of Search advertising campaigns conducted by Mega Digital customers between January and September 2024.
The Google Ads benchmarks report encompasses critical metrics such as average cost per click, average conversion rate, average click-through rate, and cost per lead, along with year-over-year variations.
Key Performance Metrics for YouTube Ads
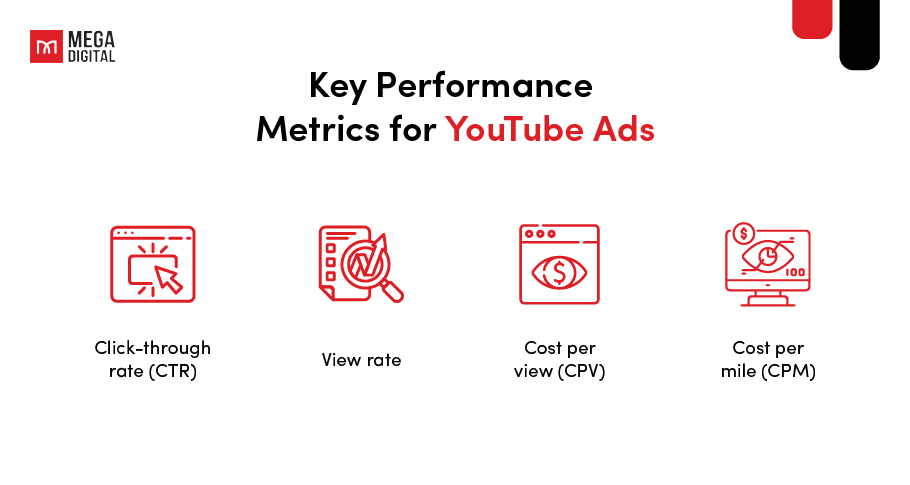
Understanding YouTube ad benchmarks is a critical step for businesses seeking to optimize their online visibility. These benchmarks serve as a point of reference against which performance or effectiveness can be measured. Key performance metrics for YouTube ads mentioned in this post include:
- Click-through rate (CTR)
- View rate
- Cost per view (CPV)
- Cost per mile (CPM)
Each of these metrics provides valuable insights into different aspects of your ad’s performance. For instance, views and impressions give you an idea of your ad’s reach, while the view rate and CTR tell you how engaging your ad is. Watch time, on the other hand, can help you understand how well your content retains viewers.
These metrics can greatly influence your marketing strategies. For example, a low CTR might indicate that your ad is not compelling enough to prompt viewers to click on it, suggesting that you might need to improve your ad copy or design. Similarly, a low view rate might mean that your ad is not reaching the right audience, indicating that you might need to refine your targeting criteria.
YouTube Ads Benchmarks 2026 by Industry
1. The average CTR
Click-through rate (CTR) is a vital metric in measuring the performance of YouTube ad campaigns. It calculated the percentage of people who click on an ad after seeing it.
For YouTube ads, the average CTR is reported to be around 0.65%. This means that for every 1000 impressions (views of the ad), there are approximately 6.5 clicks. However, it’s important to note that CTR can vary widely depending on various factors such as the ad’s content, targeting, and the industry.
When compared to other platforms, YouTube’s CTR is generally lower. This could be attributed to the different user behaviors on these platforms. On YouTube, users are primarily there to watch videos, and ads might be seen as interruptions, leading to lower CTRs.
Here’s a comparison of average CTRs for YouTube ads across different industries:
| Industry | Average CTR |
|---|---|
| Education | 0.56% |
| Fashion | 0.4% |
| Telecommunications | 0.33% |
| Baby & Child Care (CPG) | 0.35% |
| Healthcare & Insurance | 0.71% |
| Toys | 1% |
| Household essentials | 0.045% |
| Entertainment | 0.35% |
| Restaurants | 0.04% |
| Government & Advocacy | 0.07% |
| Health & Beauty | 0.44% |
| Travel | 0.78% |
| B2B | 0.37% |
| Sports | 0.31% |
| Business & Finance | 0.38% |
| Science & technology | 0.31% |
| Automotive | 0.65% |
| Gaming | 0.9% |
| Retail | 0.84% |
Several industries experience low click-through rates, including Restaurants (0.04%), Household essentials (0.045%), and Government and advocacy groups (0.07%). On the other hand, average CTRs for the Travel and Retail industries stand at the top, hovering around 0.78% and 0.84%, respectively.
While a high CTR is generally considered positive, a low CTR doesn’t necessarily mean a campaign is unsuccessful, especially if the primary goal is brand awareness or video views.
2. The average View Rate
The YouTube ad view rate is an essential metric that measures the proportion of impressions that lead to a view. To put it simply, it helps answer the question, “Out of the people who saw your video, what percentage chose to watch it?”. For instance, if your video reaches 100 people and 10 of them decide to watch it, your view rate is 10%. This metric offers valuable insight into how compelling your video is at first glance.
So what is a good view rate for YouTube Ads by your industry’s standard? A good view rate can vary depending on the industry, ad format, targeting, and audience. The average YouTube Ads view rate is reported to be approximately 31.9%. However, generally speaking, a view rate of around 15% or higher is considered good for in-stream ads, while a view rate of 2% or higher is a benchmark for video discovery ads.
Here’s a comparison of average view rates for YouTube ads across different industries:
| Industry | Average View Rate |
|---|---|
| Education | 35.4% |
| Fashion | 32% |
| Telecommunications | 31.9% |
| Baby & Child Care | 31.2% |
| Healthcare & Insurance | 31.2% |
| Toys | 31% |
| Household Essentials | 30.7% |
| Entertainment | 30.2% |
| Restaurants | 29.7% |
| Government & Advocacy | 29.6% |
| Health & beauty | 29.6% |
| Travel | 29.6% |
| Business & Finance | 35.4% |
| Sports | 35.4% |
| Business & Finance | 35.4% |
| Science & technology | 35.4% |
| Automotive | 35.4% |
| Gaming | 24% |
| Retail | 15.7% |
Overall, most industries experience relatively high view rates, with some groups including education, business and finance, science and technology, automotive, electronics, and home and garden record view rates over 35%. Only retail advertisers see a much lower-than-average benchmark of just 15.7%. This low rate can be attributed to the high competition and saturation within the retail sector.
3. The average CPV
The Cost PerView – CPV is calculated by dividing the total ad spend on the campaign by the number of views.
Before diving into this benchmark, I want to make sure you fully get a grasp of how a view is counted on YouTube. When someone watches 30 seconds of a video ad (or the entire ad if it’s shorter than 30 seconds) or interacts with the ad, whichever comes first, a view is counted.
And one more important point: If there is no view, you pay no money. For instance, if someone watches the first 5 seconds of your ad but then skips, you don’t need to pay.
The average YouTube Ads CPV stands at $0.026. However, this can vary depending on factors such as the content of the ad, targeting, and the industry.
Here’s a comparison of average CPVs for YouTube ads across different industries:
| Industry | Average CPV |
|---|---|
| Education | $0.037 |
| Fashion | $0.046 |
| Telecommunications | $0.048 |
| Baby & Child Care (CPG) | $0.035 |
| Healthcare & Insurance | $0.071 |
| Toys | $0.038 |
| Household essentials | $0.047 |
| Entertainment | $0.035 |
| Restaurants | $0.037 |
| Government & Advocacy | $0.040 |
| Health & beauty | $0.034 |
| Travel | $0.047 |
| B2B | $0.037 |
| Sports | $0.034 |
| Business & Finance | $0.048 |
| Science & technology | $0.038 |
| Automotive | $0.058 |
| Gaming | $0.046 |
| Retail | $0.045 |
Overall, CPV by industry greatly varies, with Healthcare & Insurance sitting at the top, showcasing the highest average CPV of $0.071. The Automotive and Business & Finance industries follow at a distant second and third, with an average cost of $0.058 and $0.048 respectively. The high CPV of these industries indicates that the advertiser is spending more money for each view of their video ad on YouTube.
On the other end of the spectrum, the Health & Beauty industry has the lowest CPV. This suggests that the advertising campaign in this industry overall is relatively cost-effective in generating views.
4. The average CPM
Cost Per Mile (CPM), also known as cost per thousand impressions, is a key metric for YouTube ads. It represents the cost an advertiser pays for every 1,000 impressions of their ad. An impression is recorded each time an ad is displayed on YouTube.
The average CPM for YouTube ads is reported to be around $3.53.
Here’s a comparison of average CPMs for YouTube ads across different industries:
| Industry | Average CPM |
|---|---|
| Education | $3.70 |
| Fashion | $4.60 |
| Telecommunications | $4.80 |
| Baby & Child Care (CPG) | $3.50 |
| Healthcare & Insurance | $7.10 |
| Toys | $3.80 |
| Household appliances | $4.70 |
| Entertainment | $3.50 |
| Restaurants | $3.70 |
| Government & Advocacy | $4.00 |
| Health & beauty | $3.40 |
| Travel | $4.70 |
| B2B | $3.70 |
| Sports | $3.40 |
| Business & Finance | $3.30 |
| Science & technology | $3.20 |
| Automotive | $2.90 |
| Gaming | $4.30 |
| Retail | $3.20 |
The Healthcare & Insurance industry has the highest CPM at $7.10, followed by Telecommunications and Travel at $4.80 and $4.70, respectively. On the other hand, the Automotive sector recorded the lowest CPM of only $2.90, followed by both the Science & Technology and Retail sectors at $3.20.
>>> Read more: How much do YouTube Ads Cost in 2026? [Detailed Breakdown]
How to Improve Your YouTube Ad based on these Benchmarks
The ultimate goal of sharing these benchmarks, from my perspective, is to offer some insight into what’s happening in your account and your ad campaigns.
Is it essential to meet or exceed all the averages presented here? Probably not, but if you deviate too much, chances are you’re not performing as well as other advertisers. This could result in paying 2-5 times more for a single view or click compared to the top-performing advertisers.
By identifying which of your ads or ad groups fall short or surpass your baseline or the benchmark, you can guide your optimization efforts! Discover practical tips and strategies to enhance YouTube ad benchmarks based on these metrics.
If you encounter any difficulties while using these benchmarks to evaluate your YouTube Ad campaigns and make adjustments if needed, instead of trying to figure it out yourself, you should ask for assistance from veteran Google Ads experts from trusted agencies, such as Mega Digital.
Ways to leverage positive metrics for your YouTube Ad
To leverage positive metrics in your ads campaigns, advertisers can follow these strategies:
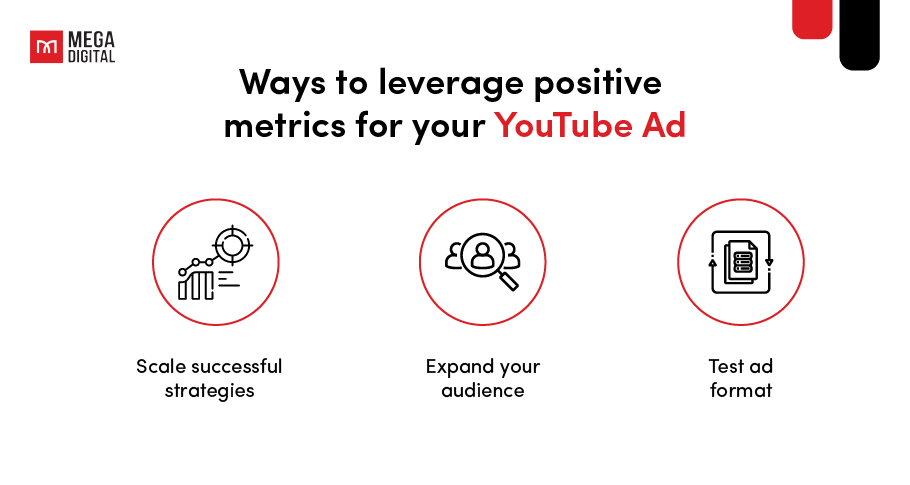
- Scale successful strategies: Identify the elements contributing to the positive CTR, such as high-performing ad creatives, effective targeting, or compelling CTAs. Scale these successful strategies by creating more content with similar attributes.
- Expand your audience: Explore opportunities to expand your target audience while maintaining relevance. Look for additional demographics, interests, or behaviors that align with your high-CTR audience to broaden your reach.
- Test ad format: Experiment with different Youtube ad formats, lengths, or placements to diversify your approach. Some formats may resonate better with specific audience segments, contributing to even higher CTRs.
By following these strategies, advertisers can furthermore improve their CTR and optimize their ad campaigns for even better performance.
Ways to improve negative metrics for your YouTube Ad
For advertisers struggling with negative metrics, I recommend you try out the following strategies to improve your ads performances:
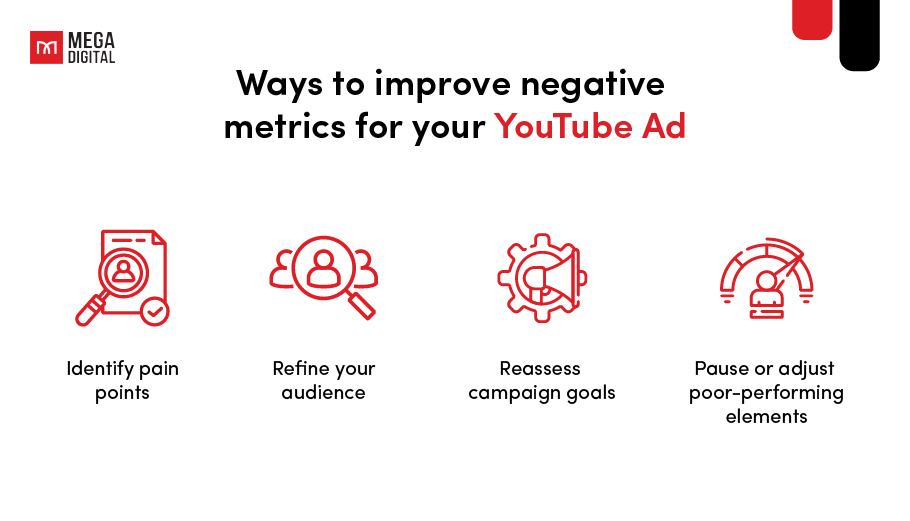
- Identify pain points: Analyze the campaign to identify specific pain points contributing to the negative CTR. This could include irrelevant targeting, unengaging creatives, or unclear messaging.
- Refine your audience: Narrow down and refine your target audience based on performance data. Ensure your ads are reaching the most relevant audience segments to improve engagement and CTR.
- Reassess campaign goals: If the negative CTR is coupled with other concerning metrics, reassess campaign goals and key performance indicators (KPIs). Adjust objectives and strategies to better align with your audience’s expectations.
- Pause or adjust poor-performing elements: If certain ad variations or targeting options consistently underperform, you should consider pausing or adjusting them. Allocating resources to the most effective elements can enhance overall campaign performance.
- Consult data analytics: Leverage data analytics tools to gain insights into viewer behavior, click patterns, and demographic information. Use these insights to inform strategic adjustments and refine your targeting strategy.
Wrap-up
Understanding all the YouTube ad benchmarks mentioned in this blog post can significantly enhance your digital marketing strategy. By leveraging these insights, businesses can optimize their YouTube ads for better engagement and higher returns.
>>> Read more: YouTube Ad Specs: All Required and Recommended Ad Sizes


