Are you looking to make your advertising campaigns more successful? The key lies in understanding the right metrics that help you track performance, optimize your strategies, and ultimately drive better results. In this blog, I’ll break down the top 15 advertising metrics you should keep an eye on for any successful advertising campaign.
- Top 15 Advertising Metrics You Must Track
- #1 Impressions
- #2 Reach
- #3 Frequency
- #4 Click-Through Rate (CTR)
- #5 Engagement Rate
- #6 Video Completion Rate
- #7 Conversion Rate
- #8 Cost Per Conversion (CPC)
- #9 Sales Revenue
- #10 Return on Ad Spend (ROAS)
- #11 Cost Per Click (CPC)
- #12 Cost Per Mille (CPM)
- #13 Customer Lifetime Value (CLV)
- #14 Bounce Rate
- #15 Repeat Purchase Rate
- Why Tracking Advertising Metrics Matters?
Top 15 Advertising Metrics You Must Track
Here are the top advertising metrics you must track for a successful campaign, highlighting key metrics for ads and how they perform to optimize your results.

#1 Impressions
Impressions refer to the total number of times your advertisement is displayed on a platform. Every time your ad appears on a user’s screen, it counts as one impression, regardless of whether the user interacts with it or not. This metric gives you an idea of how often your ad is being presented to your audience.
A high number of impressions means your ad is being shown frequently, which is beneficial for brand awareness campaigns. However, high impressions alone do not guarantee success. If your ad fails to generate clicks or engagement, it might indicate irrelevant content or improper targeting.
For example, in brand awareness campaigns, millions of impressions are common, while smaller campaigns may target tens of thousands.
#2 Reach
Reach is the number of unique users who have seen your ad. Unlike impressions, which count total ad views, reach only counts distinct users. If you want to know how many people your campaign is actually reaching, this is the metric to watch. A high reach is important if your aim is to cast a wide net and expand your audience.
One key distinction here is that a high reach with low engagement might indicate that your message isn’t resonating as well as you’d like. So, it’s important to pair this metric with engagement indicators.
#3 Frequency
Frequency refers to how many times, on average, an individual sees your ad during a specific period. This metric helps you avoid overexposing your audience to the same ad, which could lead to ad fatigue. By monitoring frequency, you can strike the perfect balance, ensuring that your audience is seeing your message enough times to make an impact but not so often that they get annoyed.

This metric is essential for understanding how often your audience is exposed to your ad. A balanced frequency ensures your ad stays top of mind without annoying users. If your frequency is too low, your audience may forget your message. If it’s too high, it could lead to ad fatigue, where viewers become irritated by repeated exposure.
For brand awareness campaigns, a frequency of 2–3 is often recommended. For retargeting campaigns, higher frequencies may be acceptable, typically around 5–7.
#4 Click-Through Rate (CTR)
Click-Through Rate (CTR) is one of the most critical ppc metrics for assessing the effectiveness of your ad in driving traffic. It measures the percentage of people who click on your ad after seeing it.
So, in other words, CTR can be used to determine the extent to which your ad is compelling: if it grabs attention, gets the audience to take action, or not.

CTR is a key indicator of how engaging and relevant your ad is to the audience. A high CTR suggests that your ad resonates with users and effectively drives traffic to your landing page. On the other hand, a low CTR might indicate that your ad copy, visuals, or targeting strategy need improvement.
On Google Ads, a CTR of 2–3% is generally considered good, while social media platforms like Facebook may see lower averages, around 1%.
#5 Engagement Rate
Engagement Rate is a crucial metric for gauging how well your audience is interacting with your ad. This can include clicks, shares, likes, comments, or any other action that signals active engagement with your content.
While CTR focuses on clicks, engagement rate looks at the overall interaction with your ad, which is especially important on platforms like Instagram, Facebook, or TikTok, where user interaction is a key driver of success.

A high engagement rate is particularly important for social media ads, where user interactions can amplify your reach through algorithmic boosts. This metric helps you understand whether your ad content is connecting emotionally or practically with your audience. A low engagement rate may indicate that your ad is not engaging enough or is targeting the wrong audience.
On Instagram, an engagement rate of 1–5% is considered good, while on Facebook, it may range from 0.5–2% depending on the industry.
#6 Video Completion Rate
If you’re running video ads, the Video Completion Rate (VCR) is a must-track metric. This measures the percentage of viewers who watched your video ad from start to finish. It’s especially important for gauging the effectiveness of your video content in keeping viewers engaged throughout its entirety.

If your audience consistently finishes your video, it’s a strong indicator that the content resonates with them. On the other hand, a low completion rate might suggest that the video is too long, irrelevant, or not engaging enough at the start.
A completion rate of 50–70% is often seen as strong for short-form videos. Longer videos typically have lower rates, but retaining more than 40% of viewers is a good target.
#7 Conversion Rate
Conversion Rate measures the percentage of visitors who complete a desired action, such as making a purchase, signing up for a newsletter, or downloading a resource. In advertising, conversions are the ultimate goal turning your audience’s attention into tangible outcomes.

Unlike engagement or clicks, conversions measure concrete outcomes. A high conversion rate indicates that your landing page and offer align well with the ad’s message, creating a seamless experience for users. However, a low conversion rate often points to issues with the post-click experience, such as slow load times, unclear messaging, or irrelevant offers.
For most industries, a conversion rate of 2–5% is typical, but higher rates (e.g., 10% or more) are achievable in niche or highly targeted campaigns.
>>> Read more: Maximizing CRV: Strategies to Optimize Your TikTok Ads
#8 Cost Per Conversion (CPC)
Cost per conversion, or CPC in short, is a key metric for measuring the efficiency of your ad spend. It tells you how much you have spent to achieve a single conversion, which could be either a sale, or a lead, or whatever result you want.

This metric is vital for budget optimization. If your CPCV is too high compared to the lifetime value (CLV) of a customer, your campaign may not be sustainable in the long term. Regularly monitoring CPCV helps identify whether your campaign is financially viable and if adjustments are needed in targeting or bidding strategies.
CPCV varies widely by industry. For eCommerce, a cost per conversion below $20–$30 is often ideal, though it could be much higher for industries like real estate or software.
#9 Sales Revenue
Sales Revenue is a direct measure of how much money your advertising campaign has generated. It’s an essential metric for evaluating the financial impact of your ads, as it shows whether your campaigns are contributing to business growth and profitability.

Tracking sales revenue helps determine the effectiveness of your campaign in driving purchases and boosting overall profitability. It also allows you to compare the revenue against ad spend to calculate your return on ad spend (ROAS). This metric is particularly crucial for campaigns focused on direct sales, where the ultimate goal is revenue generation.
The benchmark depends on your product or industry. For example, in eCommerce, generating $5–$10 in revenue for every dollar spent on advertising is considered strong performance.
#10 Return on Ad Spend (ROAS)
Return on Ad Spend is one of the most critical metrics for determining the profitability of your advertising campaigns. It measures the total revenue generated from your ad campaign in relation to how much you spent on that campaign.
Essentially, ROAS helps you understand the financial return you’re getting for every dollar spent on advertising.

A high ROAS signifies that your ads are generating substantial returns relative to their cost, making the campaign highly profitable. Conversely, a low ROAS might indicate issues with targeting, messaging, or product-market fit. Regular analysis of ROAS allows you to reallocate your budget to the most effective campaigns or ad sets.
A ROAS of 4:1 (i.e., $4 revenue for every $1 spent) is a good benchmark for most industries. However, for competitive sectors like eCommerce, a ROAS of 2–3:1 may still be acceptable depending on profit margins.
>>> Read more: Target ROAS in Google Ads: What is it and How to Maximize ROAS?
#11 Cost Per Click (CPC)
Cost Per Click is the amount you pay for each individual click on your ad. This metric is a key indicator of how cost-efficient your campaign is in driving traffic to your website or landing page.

Lower CPC values are often preferable, as they allow you to get more traffic for the same budget. However, an extremely low CPC might indicate that the traffic isn’t highly targeted or qualified. Balancing CPC with conversion metrics is essential for ensuring that your clicks translate into meaningful actions.
CPC benchmarks differ by industry and platform. For example, on Google Ads, CPCs typically range from $1 to $3 for most industries, but highly competitive niches like legal services or finance can exceed $50 per click.
#12 Cost Per Mille (CPM)
Cost Per Mille, also known as Cost Per Thousand Impressions, measures how much you’re paying for every 1,000 impressions of your ad. This metric is especially relevant for brand awareness campaigns where the focus is on visibility rather than clicks or conversions.

CPM is useful for comparing the cost-efficiency of reaching large audiences across different campaigns or platforms. While low CPM is generally favorable, it’s equally important to ensure that the impressions are reaching the right audience to maximize impact.
The metric typically ranges from $5 to $10 on platforms like Facebook and Instagram, though it can be higher for premium ad placements or highly targeted audiences.
>>> Read more: TikTok CPM: Understanding Rates, Costs & How to Optimize
#13 Customer Lifetime Value (CLV)
Customer Lifetime Value estimates the total revenue a business can expect from a single customer over the course of their relationship. It’s a forward-looking metric that helps determine how much you can afford to spend on acquiring new customers while maintaining profitability.

CLV is critical for understanding the long-term impact of your campaigns. A higher CLV allows for more flexibility in ad spending, as the initial acquisition cost can be offset by repeat purchases over time.
Benchmarks depend heavily on the industry. For eCommerce, an average CLV of $100–$200 is typical, while SaaS companies may aim for values exceeding $1,000.
#14 Bounce Rate
Bounce Rate refers to the percentage of visitors who leave your landing page without taking any action, such as clicking a link, filling out a form, or making a purchase. This metric is a direct reflection of how well your landing page aligns with the expectations set by your ad.

A high bounce rate often indicates a mismatch between the ad content and the landing page, slow page load times, or unappealing page design. Reducing bounce rate is essential for maximizing the ROAS of your ad campaigns.
For most websites, a bounce rate of 26–40% is excellent, 41–55% is average, and anything above 70% is concerning.
#15 Repeat Purchase Rate
Repeat Purchase Rate measures the percentage of customers who make additional purchases after their initial one. It’s an essential metric for understanding customer loyalty and the effectiveness of your retention strategies.

A high repeat purchase rate indicates that your product or service meets customer expectations and builds loyalty, reducing the need to invest heavily in customer acquisition. Campaigns focused on retention and loyalty programs can significantly impact this metric.
A repeat purchase rate of 20–30% is common for most industries, while subscription-based businesses or strong loyalty brands may achieve rates above 50%.
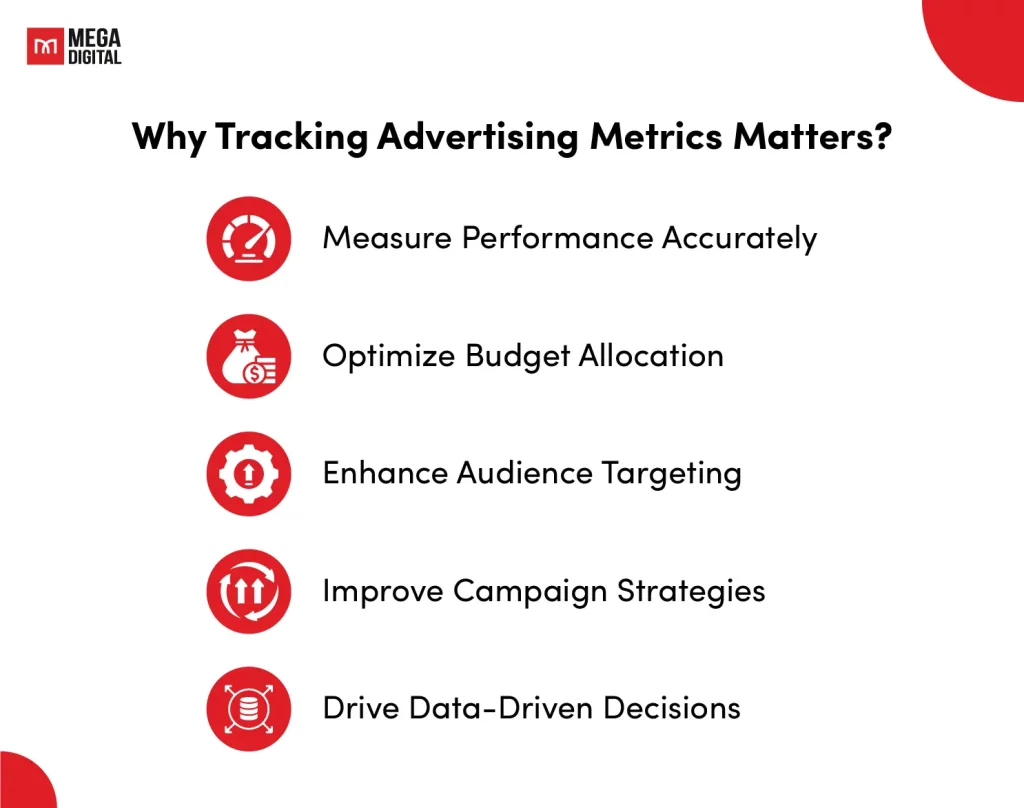
Why Tracking Advertising Metrics Matters?
Measure Performance Accurately
It provides precise advertisement analytics which help you analyze your campaign efforts. Through tracking the dimensions like CTR, conversion rate, and ROAS, you can see what works and doesn’t.
Is your campaign driving traffic conversions or revenue increases or raising brand awareness? Performance measures reveal whatever it is returning on that objective. Without all this data, you’re in dark-shadow land assessing performance and figuring out points for development.
Optimize Budget Allocation
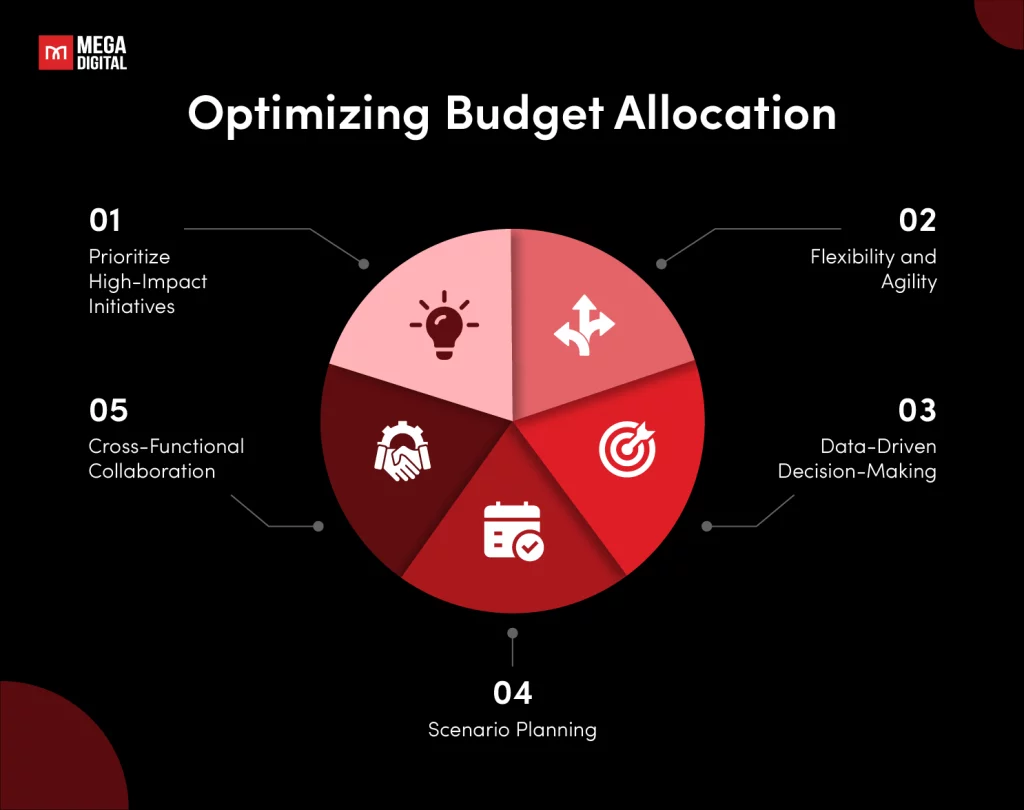
Tracking metrics is one of the keys to effective budget allocation for many marketers. You can make decisions on where to invest your advertising dollars by analyzing CPC, CPM, and ROAS. You would be able to reallocate ad spending to the campaigns, ad sets, or channels that yield the best return on investment so that you could reduce spending in channels that aren’t performing as well.

For instance, if one of the platforms has a lower cost per click with a higher conversion rate, transferring more budget to that particular site will increase return on advertisement investment.
Enhance Audience Targeting
Impression, reach, and engagement rate are some of the metrics that reflect how well your ads connect with your audience measures through which one might be able to say whether your ad campaigns are resonating with the audience you want. You can then hone your targeting strategy to identify the right audience at the right time through such metrics analysis.
For instance, if the frequency metric suggests that your ad is being shown too frequently to the same viewership and hasn’t resulted in conversion, it is time to alter the targeting or widen the audience. Effective audience targeting can help reduce ad fatigue so that your campaigns will continue to be relevant and impactful.
Improve Campaign Strategies
The tracking of metrics lets you identify trends and other such patterns in your findings and apply them to your campaign strategy. High bounce rates indicate that the landing page does not match the ad’s expectations, therefore the page can be modified for more matching in that line.
Video completion rates can indicate whether or not your video ads are lengthy enough or too short. All the above show the sense of talking data into the arc on a regular basis to obtain much better campaigns.

Drive Data-Driven Decisions
In this day and age, intuition is not enough anymore to survive in today’s marketplace. Advertising metrics will offer hard information that encourages the making of informed choices: which times to use ads, which platforms are best used for them, and what tweaks are needed in creative approaches.
Metrics ensure that each even their call by evident proof to support it: every decision can be traced back to a solid foundation. The results, in other words, would measure the effectiveness of the efforts to build not only efficiency but also confidence in your marketing efforts.
>>> Read more: 20 Best PPC Tools: Main Features and Tips to Leverage Them
Conclusion
In this article, I’ve identified the most significant advertising metrics to track and explain their value. Understanding these indicators can help you assess and optimize your ads more successfully. I hope this article motivates you to use these data points to make more informed decisions and achieve higher success in your advertising campaigns.


