With Google Analytics (GA4), the latest version of Google’s web analytics platform, you gain access to advanced features and insights that help you understand your website’s performance and user behavior. In this guide, besides answering “what is Google Analytics?”, we’ll explore what does GA4 do, its key benefits, and a step-by-step process to set it up, so you can start using it for your website.
What is Google Analytics?
Google Analytics 4 is a web analytics service provided by Google that tracks and reports website traffic. By using a tracking code, Google Analytics collects data on user behavior on the website, including the number of visits, average time spent on pages, bounce rate, and traffic sources. This tool provides detailed and visual reports, allowing businesses to understand how users interact with their site and make data-driven decisions to improve their online presence and marketing strategies.
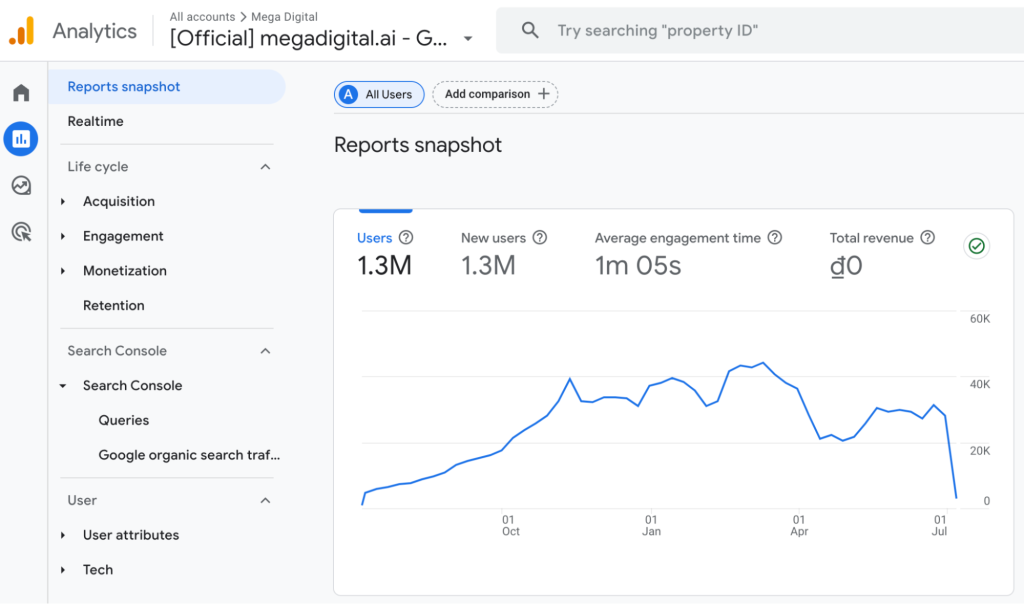
With Google Analytics, companies can gain insights into their audience demographics, interests, and behaviors. It also integrates with other Google services like Google Ads and Search Console, enabling a comprehensive view of marketing performance and website effectiveness. This makes it an essential tool for optimizing user experience and achieving business goals.
Pros and Cons of Google Analytics
Considering Google Analytics for your website? Here’s a look at the key pros and cons to help you decide if it’s the right tool for your needs.
Pros of Google Analytics
Comprehensive Data Collection
Google Analytics tracks a wide range of user interactions, providing detailed insights into website traffic, user behavior, and conversions. For example, it can monitor page views, session duration, bounce rate, and specific user actions such as form submissions or product purchases. This comprehensive data helps businesses understand how visitors interact with their website and identify areas for improvement.
Real-Time Data
Google Analytics provides real-time analytics, enabling businesses to monitor and respond to user behavior as it happens. For example, during a promotional campaign, a company can track real-time visitor counts, user engagement, and conversion rates, allowing them to make immediate adjustments to their marketing tactics if necessary.
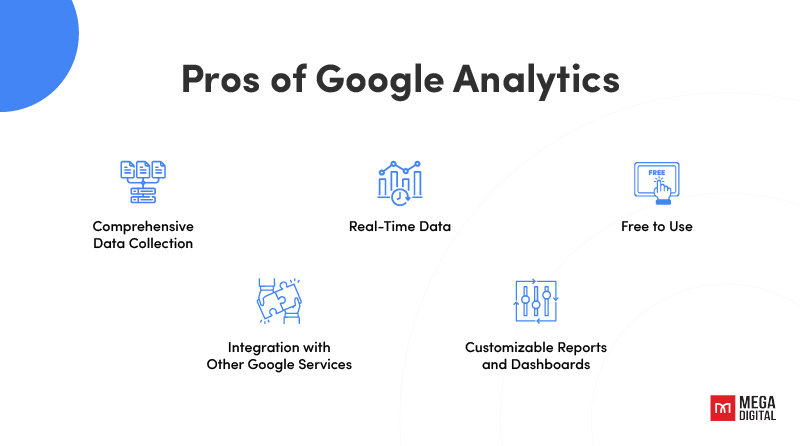
Free to Use
The standard version of Google Analytics is free, making it accessible for businesses of all sizes. For instance, a small e-commerce store can utilize the full range of analytics tools without incurring additional costs, allowing them to optimize their marketing strategies and improve sales without a significant financial investment.
Integration with Other Google Services
Google Analytics seamlessly integrates with other Google products like Google Ads, Search Console, and Data Studio. For example, by linking Google Ads, businesses can track the performance of their ad campaigns directly within Google Analytics, seeing metrics such as clicks, conversions, and ROI. This integration enables a more comprehensive view of marketing performance and website effectiveness.
Customizable Reports and Dashboards
Users can create custom reports and dashboards tailored to their specific needs, facilitating easier data interpretation. For instance, an online retailer can set up a dashboard that highlights key metrics such as daily sales, top-performing products, and customer acquisition sources, allowing them to quickly assess business performance and make data-driven decisions.
Cons of Google Analytics
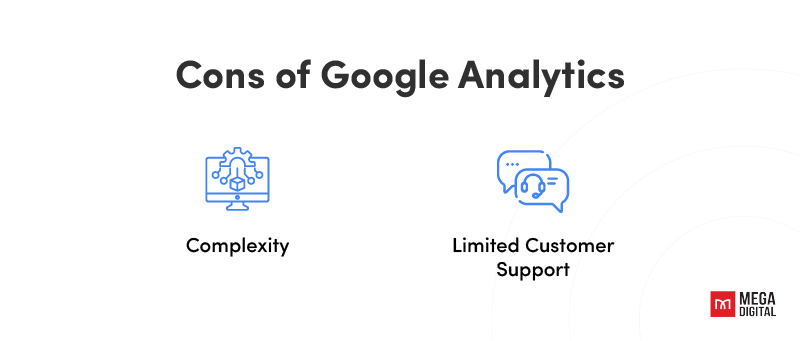
Complexity
The platform can be complex and overwhelming for beginners, requiring a learning curve to fully understand and utilize its features. For instance, new users might find it challenging to set up tracking codes correctly, configure custom reports, or interpret the wide array of available data.
Limited Customer Support
Free users have limited access to customer support, which can be a drawback for those needing assistance with complex issues. For example, if a small business encounters a problem with tracking code implementation, they might struggle to find timely help, affecting their ability to gather accurate data.
How Does Google Analytics Work?
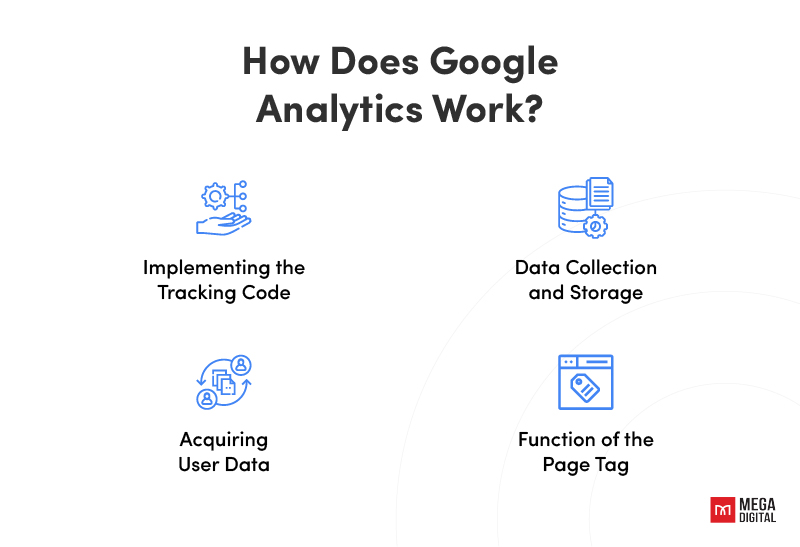
1. Implementing the Tracking Code
For Google Analytics to work on the business user’s website (meaning, to capture and display useful analytics), the user must add a small piece of JavaScript measurement code to each page on their site. This tracking code will collect pseudonymous information such as:
- How a site visitor interacted with the page.
- Which browser the visitor used.
- The browser’s language setting.
- Which device and operating system the browser is running on.
- Which traffic source (search engine, online ad, email marketing campaign, etc.) brought the user to the site.
Google Analytics will not collect data for any page lacking the tracking code.
2. Data Collection and Storage
All collected data is aggregated and stored in a database. It is also organized and processed. Google Analytics creates reports that can help users better understand their customers and marketing results. Once processed data is stored in a database, it cannot be modified, so it’s important for users to be careful about excluding data. These exclusions usually happen when users (mistakenly) assume they won’t need some types of data for analysis and, on that basis, add filters to exclude it from analysis in Google Analytics.
3. Acquiring User Data
Google Analytics acquires user data from each website visitor through page tags. A JavaScript page tag, inserted into the code of each page, helps generate data such as:
- The number of users
- Bounce rates
- Average session duration
- Sessions by channel
- Pageviews
- Goal completions
4. Function of the Page Tag
The page tag functions as a web bug or web beacon to gather visitor information. Because it relies on cookies, the system can’t collect data for users who have disabled them.
Universal Analytics vs Google Analytics 4
Universal Analytics (UA) is the previous version of Google’s web analytics platform, designed to track and report website traffic and user interactions. It provides comprehensive insights into how visitors engage with a website, allowing businesses to optimize their online presence and marketing strategies.
Below is a comparison table of Universal Analytics and Google Analytics 4.
| Feature | Universal Analytics | Google Analytics 4 |
|---|---|---|
| Interface | Extensive sidebar reports with detailed options. | Streamlined interface with fewer sidebar reports, focusing on essential data. |
| Tracking Method | Hit-based tracking, includes: Page Hits, Event Hits, E-commerce Hits, Social Media Hits. | Event-based tracking, where every interaction is recorded as an event, such as: Session Start, First Visit, Page Views, Form Submission. |
| Event Categories | Events are categorized by: Category, Action, Label, Value. | Events are more flexible and can include: Automated Data Collection, Custom Events, Suggested events like logging in or registering. |
| Goals and Conversions | Goals can be set to track conversions such as form submissions, downloads, or purchases. | No traditional goals; events can be customized and labeled to track specific actions and conversions. |
| Page Views | Tracks page views with attributes such as: Page_path, Page_title, Page_attributes. | Uses the page_view event to track page views, simplifying the process. |
| Sessions | Sessions include all user interactions within a set time frame, encompassing: Page Views, Conversions, Interactions. | Sessions are event-based, with the start of a session marked as an event. The duration is measured from the first to the last event. |
| Integration | Integrates with other Google services like Google Ads, Search Console, and Data Studio. | Seamlessly integrates with a wide range of Google services for enhanced data analysis and marketing insights. |
| User Interface | Separates user analytics from event analytics, offering more detailed reports for each. | Combines user and event analytics into a unified interface, providing a holistic view of user interactions. |
| Customization | Allows for customizable reports and dashboards to fit specific business needs. | Offers advanced customization options, enabling more tailored and specific data analysis. |
| Real-Time Data | Provides real-time monitoring and reporting of user interactions and website performance. | Also provides real-time data, with enhanced tracking capabilities for immediate insights into user behavior. |
In conclusion, GA4 differs from UA in several ways:
- Terminology for User Interactions: UA calls user interactions “hits,” with different hit types for page views, events, and other interactions. In contrast, GA4 calls all user interactions “events.”
- Changes to the Google Analytics Account Structure: UA accounts could contain multiple properties, which could, in turn, contain multiple views for creating filtered data segments. GA4 accounts can still contain multiple properties, but they cannot contain views. Unlike UA properties, GA4 properties can receive multiple data streams from websites and apps, instead of tracking data from only one source.
How to Set up Google Analytics?
Here’s a step-by-step guide on how to set up Google Analytics.
Step 1: Create a GA4 Account
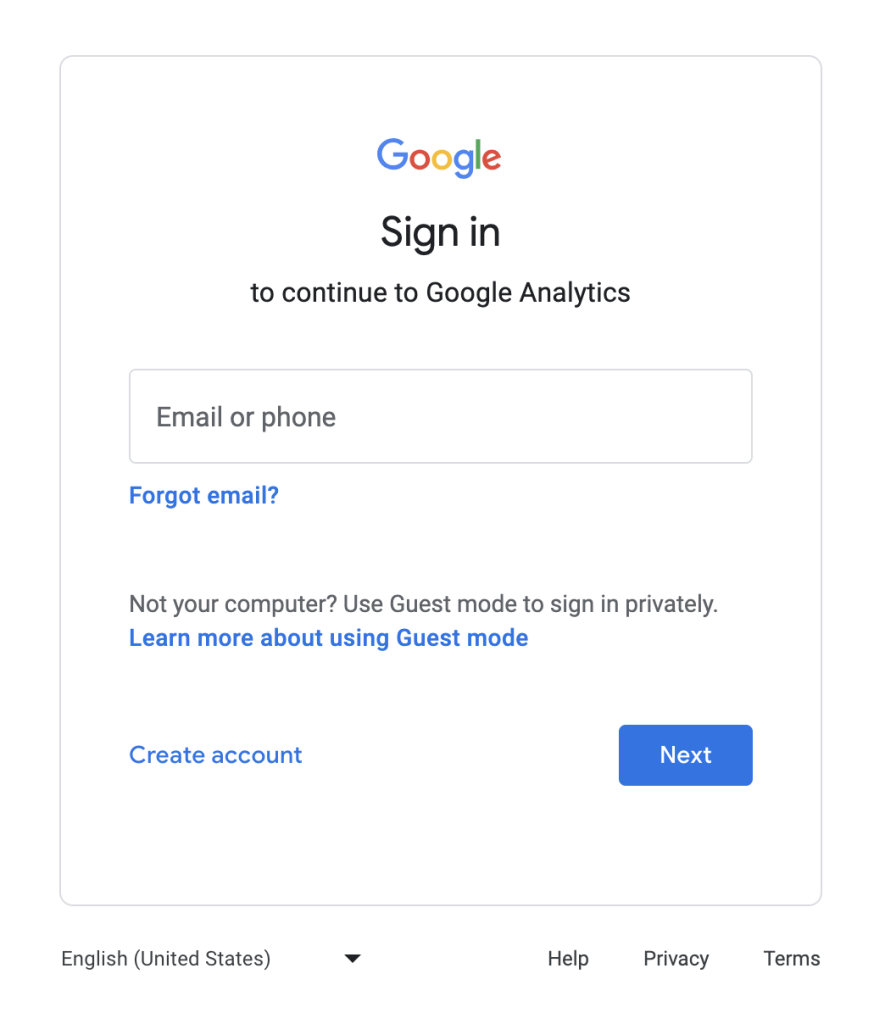
To set up GA4, you need a Google Analytics account. If you don’t have a GA4 account yet, visit Google Analytics and log in with your Google account to create one.
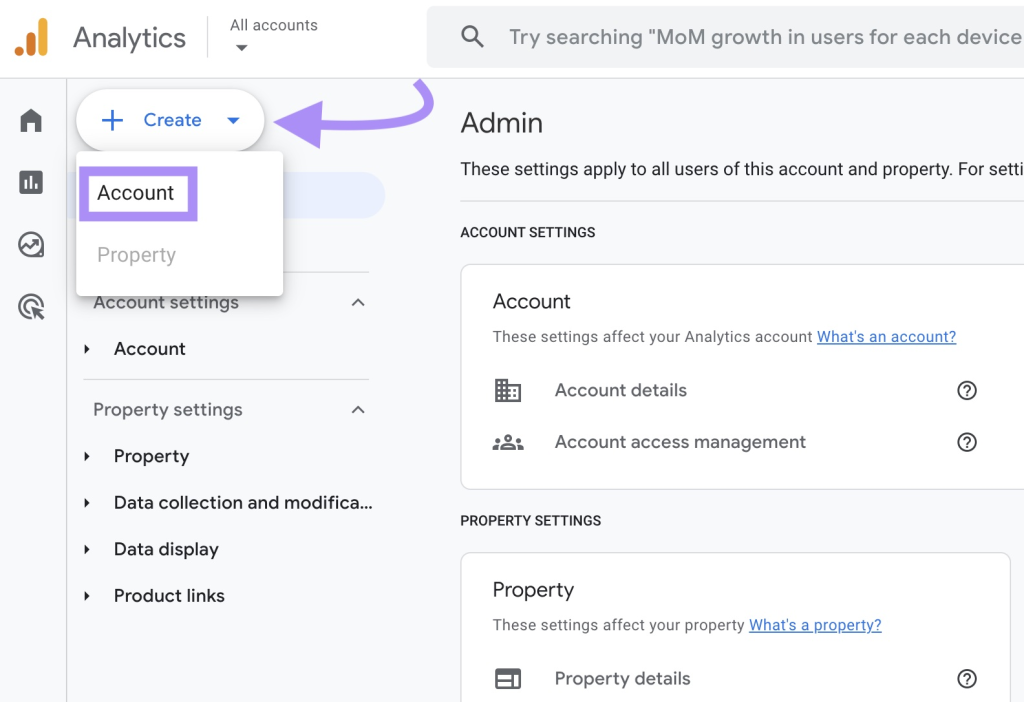
After logging in, click the gear icon on the left sidebar to open the “Admin” settings.
Next, on the Admin dashboard, click “+ Create” and then select “Account” to set up your Google Analytics account.
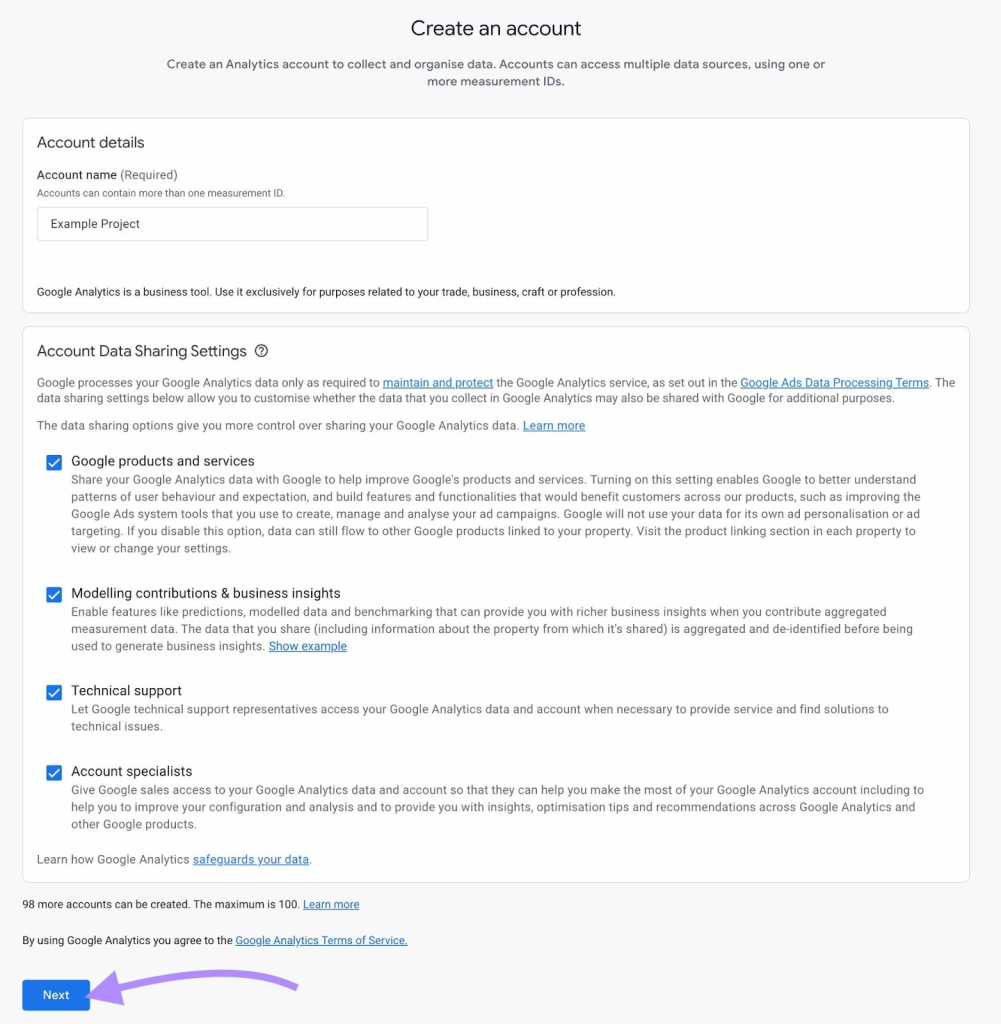
Enter a name for your account in the “Account name” field. Use the “Account Data Sharing Settings” to choose the purposes for which you are willing to share your data with Google.
When you have finished, click “Next.”
Step 2: Create a GA4 Property
The next step is to create a property in your GA4 account.
A property is a collection of data from a website and/or app. A simple GA4 property example is a property that contains data from just one website or one app.
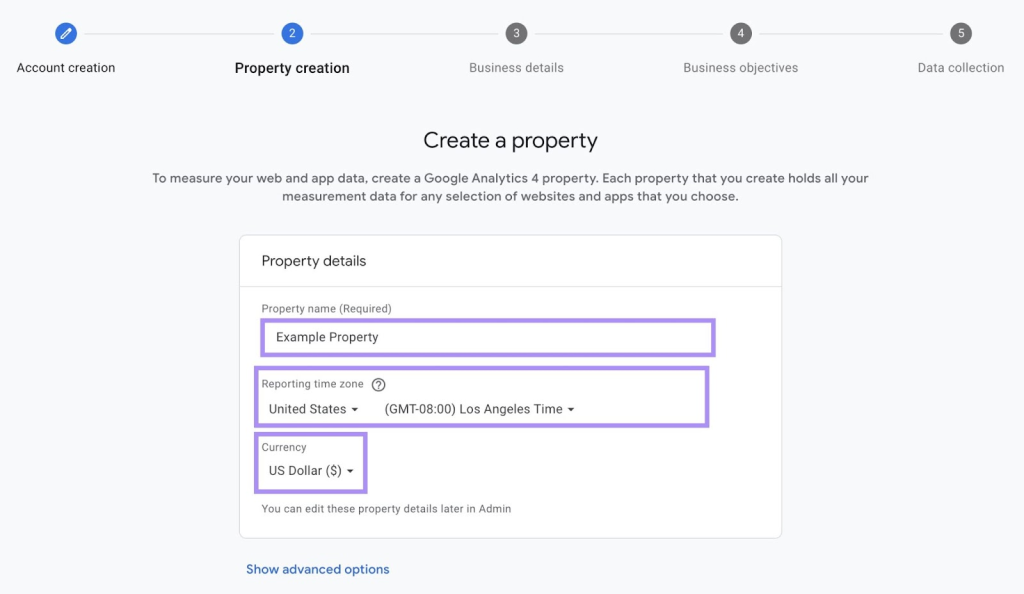
To create a GA4 property, enter a name in the “Property name” field. The name must be at least four characters long.
Next, specify your preferred time zone and currency for your reports. Click “Next” to proceed.
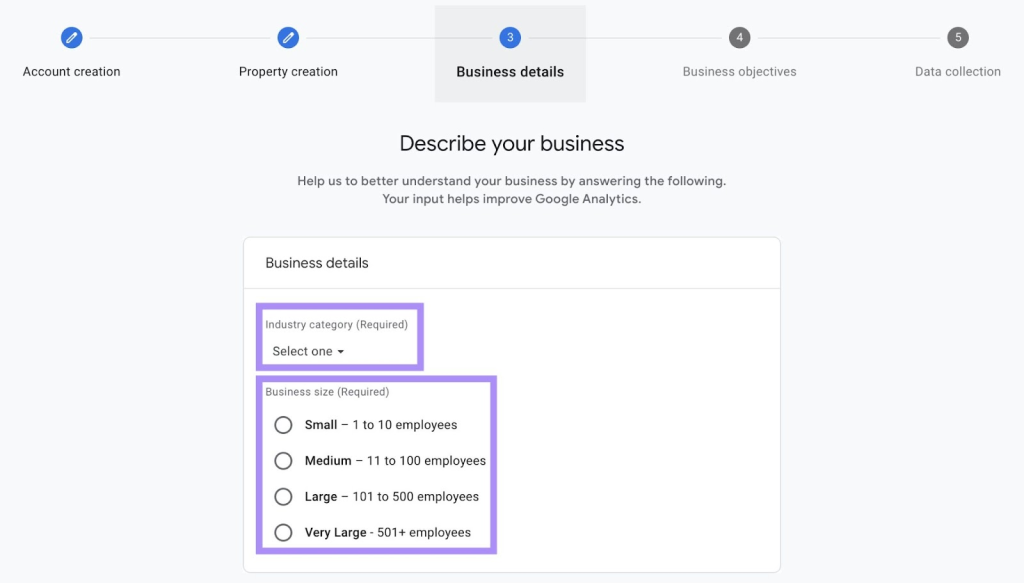
Step 3: Provide Your Business Details
Fill out the “Industry category” and “Business size” fields.
Step 4: Provide Your Business Objectives
Select at least one of the business objectives displayed on the screen. This helps GA4 customize its default reports to better meet your needs.
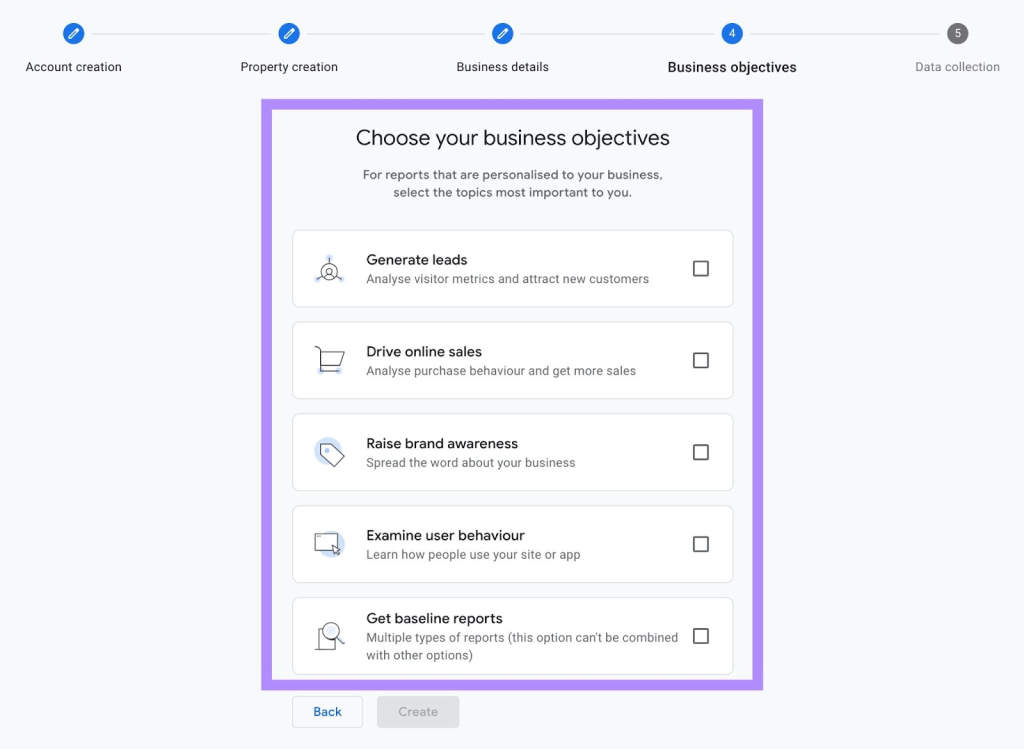
If you select “Get baseline reports,” GA4 will provide a collection of reports covering activity across the customer life cycle, rather than reports tailored to a specific business objective.
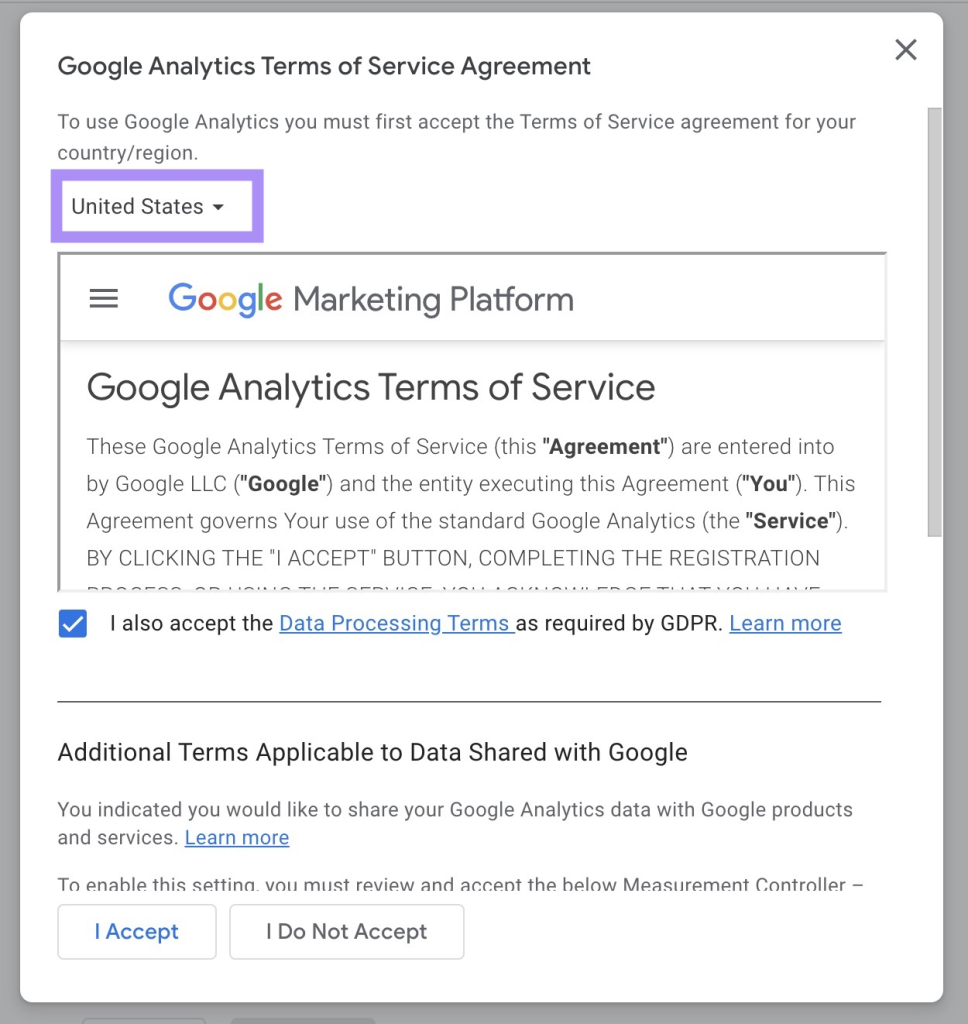
The Google Analytics terms of service agreement will appear on the screen. Adjust the country setting to view the appropriate agreement for your geographical region if necessary. Review the terms of service. If you accept them, click “I Accept” to proceed to the next step.
Step 5: Create a Data Stream
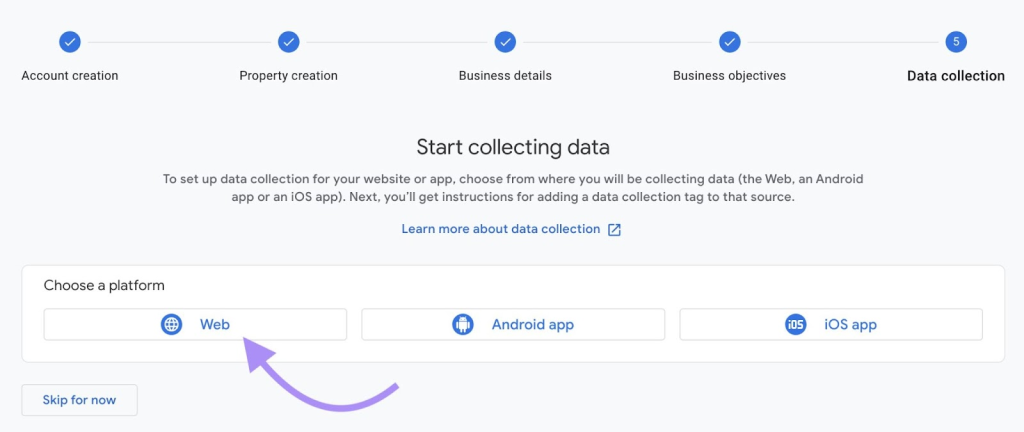
The final step is to create a data stream, which will send data from your website or app to your GA4 property.
The steps for creating a data stream differ depending on whether your data source is a website, iOS app, or Android app.
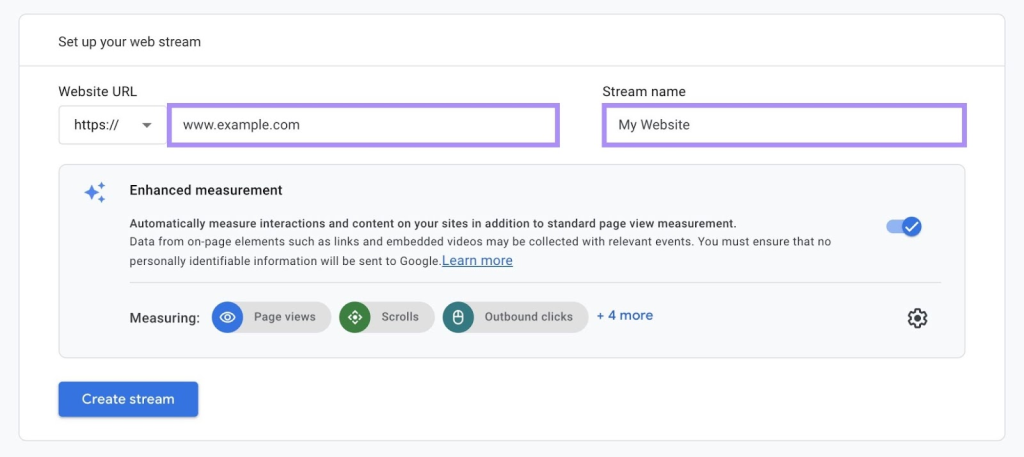
To create a data stream from a website, click “Web.”
Enter your domain into the “Website URL” field and provide a name for your data stream in the “Stream name” field. Afterward, click “Create stream.”
A window will appear, displaying your data stream’s measurement ID and additional details.
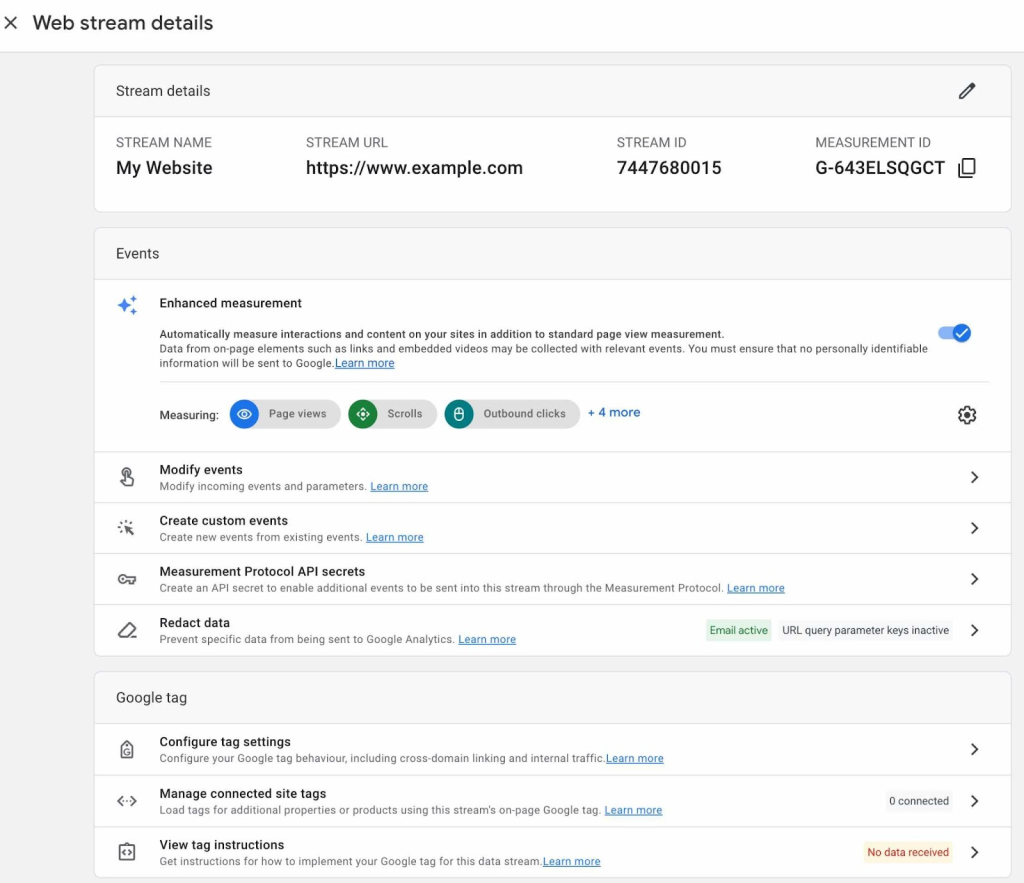
Save the measurement ID to a text file for convenient reference—you may need it later.
After creating the data stream for your website, the next step is to install GA4 on your site.
How to Install GA4 on Your Website?
Here, I will guide you on how to install GA4 on your website using Google Tag Manager. This is the simplest and quickest method that anyone can follow.
Google Tag Manager (GTM) is a tool that allows you to add code snippets, known as “tags,” to your website without directly altering the site’s code. This includes tags for Google Analytics 4 (GA4).
During the setup, you will create a “container,” which holds all the tags and other adjustments you’ve made to your website using GTM.
Afterwards, visit Google Tag Manager and log in with your Google account.
Choose the GTM container for your website.

Click the “Add a new tag” option in your container’s workspace overview.
Then, click “Untitled Tag” to name your tag, for example, “GA4 Setup”.
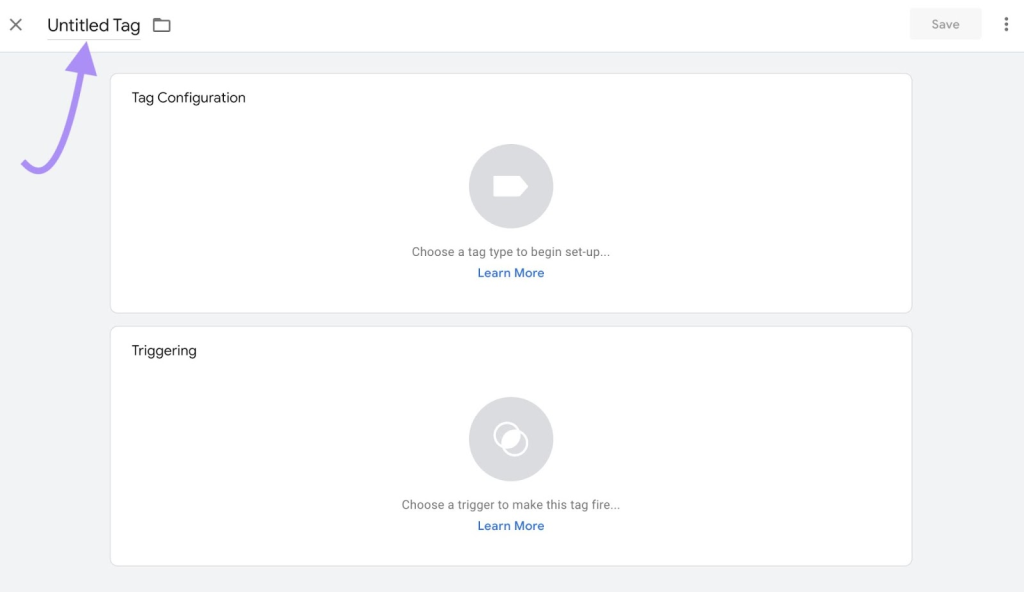
Next, click anywhere in the “Tag Configuration” panel.
From the “Choose tag type” window that appears, select “Google Tag.”
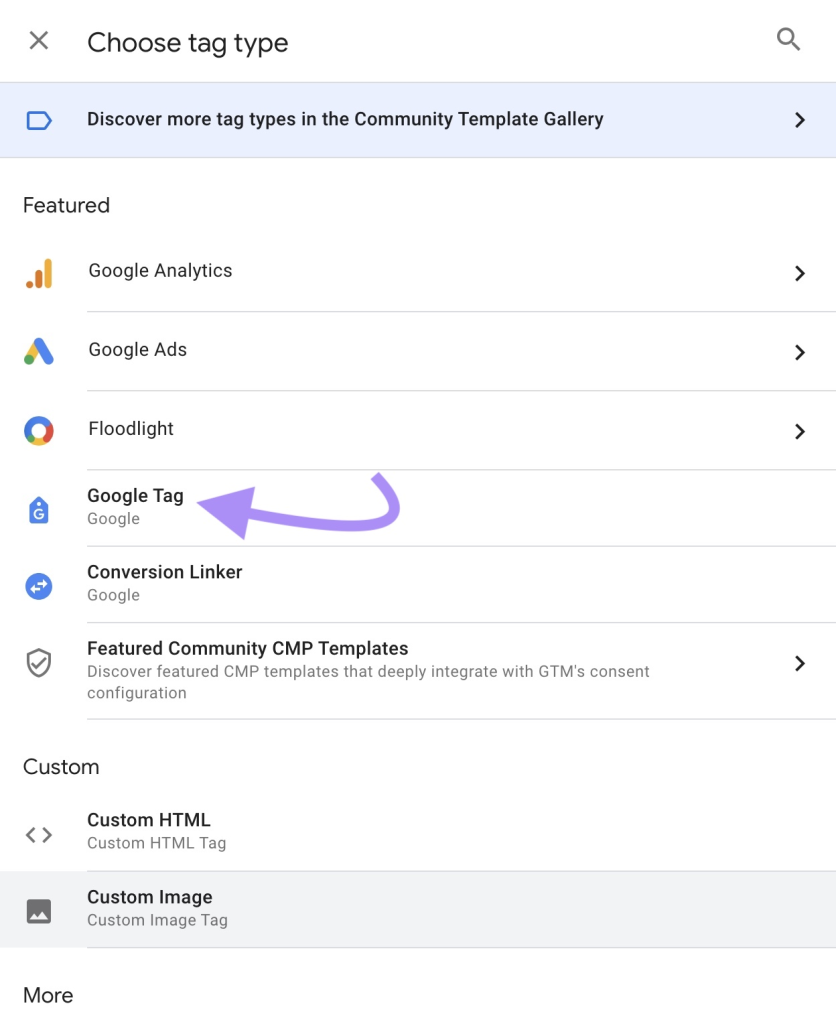
Fill in the “Tag ID” field with the measurement ID from your GA4 data stream. If you didn’t save your measurement ID after creating your data stream, you can learn how to find it here.
After that, you can optionally adjust your tag’s configuration, shared event settings, and advanced settings.
When you’re finished, click anywhere in the “Triggering” panel to set up when GTM should “fire” (or load) the GA4 tag. This will ensure that the tag sends data from your website to GA4.
In the “Choose a trigger” window that appears, select “Initialization – All Pages.” This is the default GA4 trigger option, ensuring the GA4 tag loads before any other tags on your website.

Click “Save” at the top of the tag setup window to save your new tag.
Next, test your GA4 tag by clicking “Preview” in your container’s workspace overview.
The Google Tag Assistant will open in a new browser tab. Enter your domain into the “Your website’s URL” field and click “Connect.”
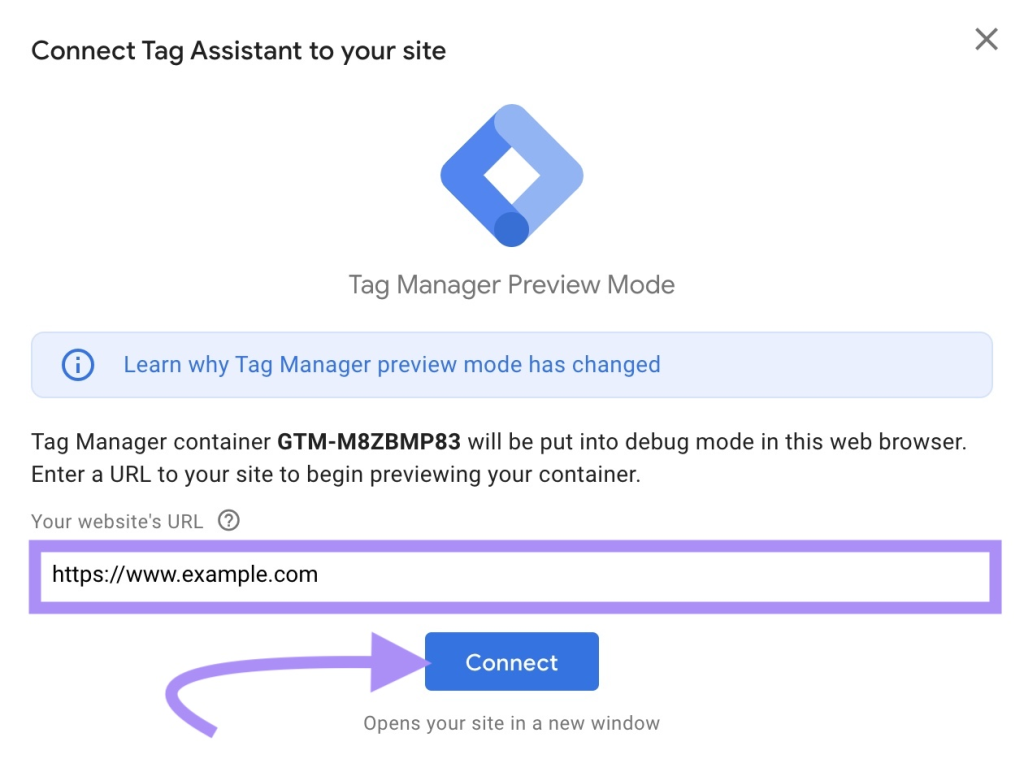
Your website will load in a new window. Keep this window open and return to the Tag Assistant page.
If Tag Assistant successfully connects to your website, a “Connected!” window will pop up. Click “Continue” to close it.
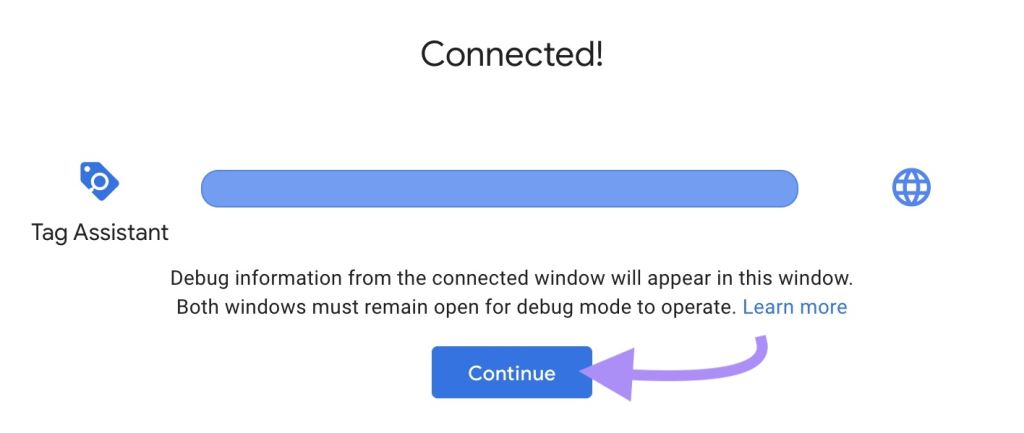
If so, close Tag Assistant and your website. Then, click “Submit” on your container’s workspace overview to save the changes to GTM.
If this is the case, close both Tag Assistant and your website. Then, click “Submit” on your container’s workspace overview to save the changes to GTM.
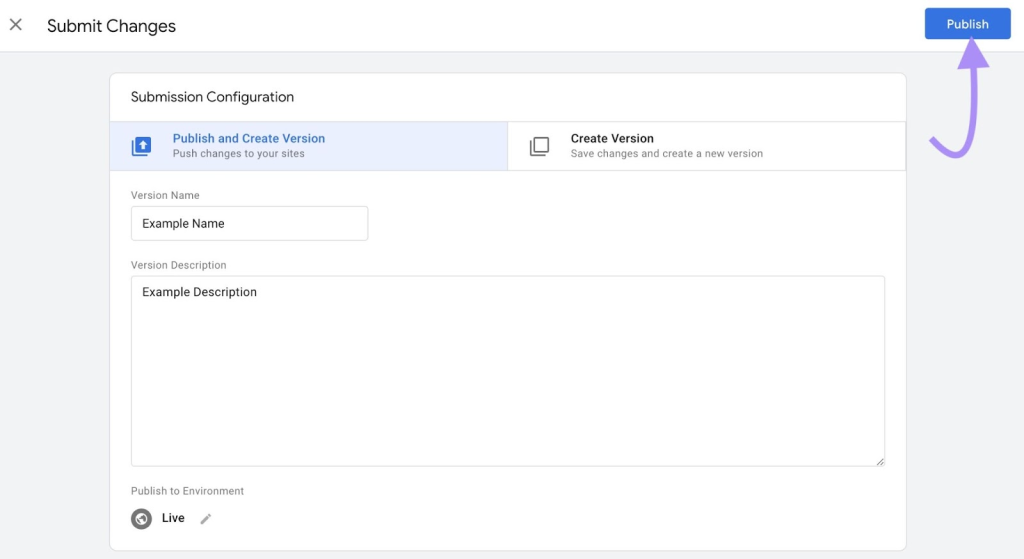
A “Submit Changes” window will appear.
Leave the “Submission Configuration” setting as “Publish and Create Version.” Then, use the following fields:
- The “Version Name” field to name the new version of your website (e.g., “GA4 installed”).
- The “Version Description” field to provide details of your changes.
Finally, click “Publish” to make your changes to GTM live and activate your website’s GA4 installation.
How to Check if Your GA4 Installation is Correct?
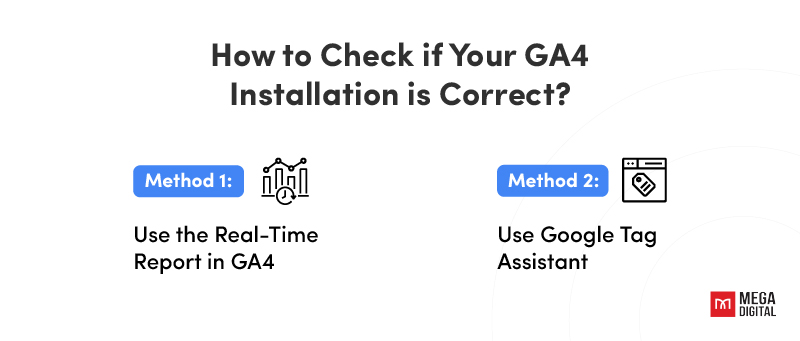
To ensure that your GA4 installation is set up correctly, you can use two methods. Here are the steps to verify your installation:
Method 1: Use the Real-Time Report in GA4
- Go to your GA4 property in Google Analytics.
- Navigate to the “Real-Time” report on the left sidebar.
- Perform actions on your website (e.g., navigate through pages, submit forms).
- Check if these actions are reflected in the real-time report. This indicates that GA4 is tracking your data correctly.
Method 2: Use Google Tag Assistant
- Open Google Tag Assistant in your browser.
- Click “Enable” and then “Record” to start tracking.
- Visit your website and perform some actions.
- Go back to Google Tag Assistant and check the results. Look for your GA4 tags under the “Tags Fired” section to ensure they are being triggered correctly.
Wrap up
In conclusion, what is Google Analytics? GA4 is a powerful tool that offers detailed insights into user interactions and website performance. With event-based tracking, flexible data collection, and seamless integration with other Google services, GA4 helps businesses make informed decisions and optimize their online presence. Using GA4, you can better understand your audience, refine your marketing strategies, and drive business growth.


